Federal Reserve Economic Data
Data in this graph are copyrighted. Please review the copyright information in the series notes before sharing.
Notes
Source: U.S. Bureau of Economic Analysis
Release: Gross Domestic Product
Units: Billions of Dollars, Seasonally Adjusted Annual Rate
Frequency: Quarterly
Notes:
BEA Account Code: A182RC
For more information about this series, please see http://www.bea.gov/national/.
Suggested Citation:
U.S. Bureau of Economic Analysis, Exports of nonagricultural goods [A182RC1Q027SBEA], retrieved from FRED, Federal Reserve Bank of St. Louis; https://fred.stlouisfed.org/series/A182RC1Q027SBEA, .
Source: U.S. Bureau of Economic Analysis
Release: Gross Domestic Product
Units: Billions of Dollars, Seasonally Adjusted Annual Rate
Frequency: Quarterly
Notes:
BEA Account Code: A187RC
For more information about this series, please see http://www.bea.gov/national/.
Suggested Citation:
U.S. Bureau of Economic Analysis, Imports of nonpetroleum goods [A187RC1Q027SBEA], retrieved from FRED, Federal Reserve Bank of St. Louis; https://fred.stlouisfed.org/series/A187RC1Q027SBEA, .
Source: U.S. Bureau of Economic Analysis
Release: Gross Domestic Product
Units: Billions of Dollars, Seasonally Adjusted Annual Rate
Frequency: Quarterly
Notes:
BEA Account Code: A191RC
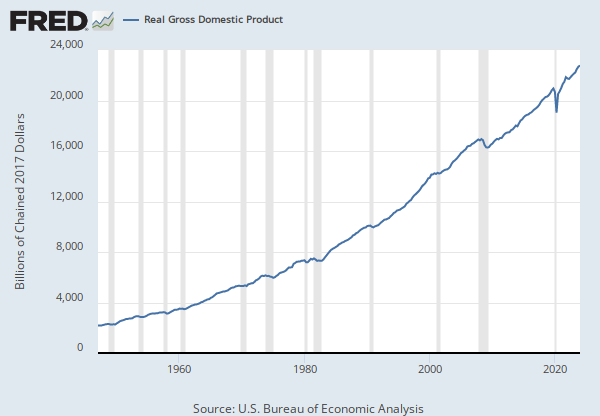
Gross domestic product (GDP), the featured measure of U.S. output, is the market value of the goods and services produced by labor and property located in the United States.For more information, see the Guide to the National Income and Product Accounts of the United States (NIPA) and the Bureau of Economic Analysis.
Suggested Citation:
U.S. Bureau of Economic Analysis, Gross Domestic Product [GDP], retrieved from FRED, Federal Reserve Bank of St. Louis; https://fred.stlouisfed.org/series/GDP, .
Source: U.S. Bureau of Labor Statistics
Release: Employment Situation
Units: Thousands of Persons, Seasonally Adjusted
Frequency: Monthly
Notes:
The series comes from the 'Current Employment Statistics (Establishment Survey).'
The source code is: CES3000000001
Suggested Citation:
U.S. Bureau of Labor Statistics, All Employees, Manufacturing [MANEMP], retrieved from FRED, Federal Reserve Bank of St. Louis; https://fred.stlouisfed.org/series/MANEMP, .
Source: U.S. Bureau of Labor Statistics
Release: Employment Situation
Units: Thousands of Persons, Seasonally Adjusted
Frequency: Monthly
Notes:
All Employees: Total Nonfarm, commonly known as Total Nonfarm Payroll, is a measure of the number of U.S. workers in the economy that excludes proprietors, private household employees, unpaid volunteers, farm employees, and the unincorporated self-employed. This measure accounts for approximately 80 percent of the workers who contribute to Gross Domestic Product (GDP).
This measure provides useful insights into the current economic situation because it can represent the number of jobs added or lost in an economy. Increases in employment might indicate that businesses are hiring which might also suggest that businesses are growing. Additionally, those who are newly employed have increased their personal incomes, which means (all else constant) their disposable incomes have also increased, thus fostering further economic expansion.
Generally, the U.S. labor force and levels of employment and unemployment are subject to fluctuations due to seasonal changes in weather, major holidays, and the opening and closing of schools. The Bureau of Labor Statistics (BLS) adjusts the data to offset the seasonal effects to show non-seasonal changes: for example, women's participation in the labor force; or a general decline in the number of employees, a possible indication of a downturn in the economy. To closely examine seasonal and non-seasonal changes, the BLS releases two monthly statistical measures: the seasonally adjusted All Employees: Total Nonfarm (PAYEMS) and All Employees: Total Nonfarm (PAYNSA), which is not seasonally adjusted.
The series comes from the 'Current Employment Statistics (Establishment Survey).'
The source code is: CES0000000001
Suggested Citation:
U.S. Bureau of Labor Statistics, All Employees, Total Nonfarm [PAYEMS], retrieved from FRED, Federal Reserve Bank of St. Louis; https://fred.stlouisfed.org/series/PAYEMS, .
Release Tables
- Table 1.1.5. Gross Domestic Product: Quarterly
- Table 1.2.5. Gross Domestic Product by Major Type of Product: Quarterly
- Table 1.3.5. Gross Value Added by Sector: Quarterly
- Table 1.4.5. Relation of Gross Domestic Product, Gross Domestic Purchases, and Final Sales to Domestic Purchasers: Quarterly
- Table 1.5.5. Gross Domestic Product, Expanded Detail: Quarterly
- Table 1.7.5. Relation of Gross Domestic Product, Gross National Product, Net National Product, National Income, and Personal Income: Quarterly
- Table 1.17.5. Gross Domestic Product, Gross Domestic Income, and Other Major NIPA Aggregates: Quarterly
- Table 4.2.5. Exports and Imports of Goods and Services by Type of Product: Quarterly
Related Data and Content
Data Suggestions Based On Your Search
Content Suggestions
Other Formats
Exports of nonagricultural goods
Annual, Not Seasonally AdjustedImports of nonpetroleum goods
Annual, Not Seasonally AdjustedGross Domestic Product
Annual, Not Seasonally Adjusted Annual, Not Seasonally Adjusted Index 2017=100, Quarterly, Not Seasonally Adjusted Millions of Dollars, Quarterly, Not Seasonally Adjusted Percent Change from Preceding Period, Annual, Not Seasonally Adjusted Percent Change from Preceding Period, Quarterly, Seasonally Adjusted Annual RateAll Employees, Manufacturing
Monthly, Not Seasonally AdjustedAll Employees, Total Nonfarm
Monthly, Not Seasonally AdjustedRelated Categories
Releases
Tags
Permalink/Embed
modal open, choose link customization options
Select automatic updates to the data or a static time frame. All data are subject to revision.


