Federal Reserve Economic Data
Data in this graph are copyrighted. Please review the copyright information in the series notes before sharing.
Notes
Source: Board of Governors of the Federal Reserve System (US)
Release: Z.1 Financial Accounts of the United States
Units: Millions of U.S. Dollars, Seasonally Adjusted Annual Rate
Frequency: Annual, End of Period
Notes:
For more information about the Flow of Funds tables, see the Financial Accounts Guide.
With each quarterly release, the source may make major data and structural revisions to the series and tables. These changes are available in the Release Highlights.
In the Financial Accounts, the source identifies each series by a string of patterned letters and numbers. For a detailed description, including how this series is constructed, see the series analyzer provided by the source.
Suggested Citation:
Board of Governors of the Federal Reserve System (US), All Sectors; Consumption Expenditures (IMA), Transactions [ASCOEXA027N], retrieved from FRED, Federal Reserve Bank of St. Louis; https://fred.stlouisfed.org/series/ASCOEXA027N, .
Source: Board of Governors of the Federal Reserve System (US)
Release: Z.1 Financial Accounts of the United States
Units: Millions of U.S. Dollars, Not Seasonally Adjusted
Frequency: Quarterly, End of Period
Notes:
For more information about the Flow of Funds tables, see the Financial Accounts Guide.
With each quarterly release, the source may make major data and structural revisions to the series and tables. These changes are available in the Release Highlights.
In the Financial Accounts, the source identifies each series by a string of patterned letters and numbers. For a detailed description, including how this series is constructed, see the series analyzer provided by the source.
Suggested Citation:
Board of Governors of the Federal Reserve System (US), Households and Nonprofit Organizations; Net Worth, Level [TNWBSHNO], retrieved from FRED, Federal Reserve Bank of St. Louis; https://fred.stlouisfed.org/series/TNWBSHNO, .
Source: U.S. Bureau of Economic Analysis
Release: Gross Domestic Product
Units: Billions of Dollars, Seasonally Adjusted Annual Rate
Frequency: Quarterly
Notes:
BEA Account Code: A262RC
A Guide to the National Income and Product Accounts of the United States (NIPA) - (http://www.bea.gov/national/pdf/nipaguid.pdf)
Suggested Citation:
U.S. Bureau of Economic Analysis, Consumption of Fixed Capital [COFC], retrieved from FRED, Federal Reserve Bank of St. Louis; https://fred.stlouisfed.org/series/COFC, .
Source: U.S. Bureau of Economic Analysis
Release: Gross Domestic Product
Units: Billions of Dollars, Seasonally Adjusted Annual Rate
Frequency: Quarterly
Notes:
BEA Account Code: A191RC
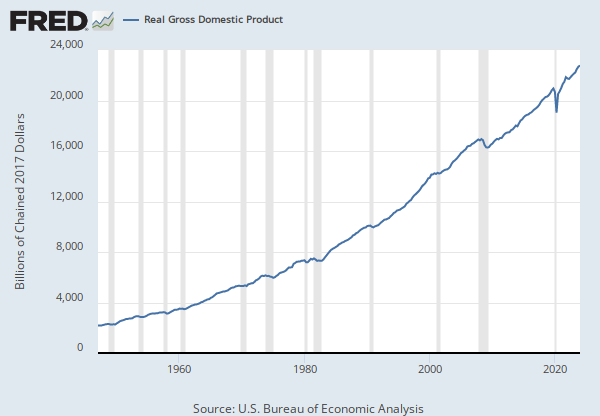
Gross domestic product (GDP), the featured measure of U.S. output, is the market value of the goods and services produced by labor and property located in the United States.For more information, see the Guide to the National Income and Product Accounts of the United States (NIPA) and the Bureau of Economic Analysis.
Suggested Citation:
U.S. Bureau of Economic Analysis, Gross Domestic Product [GDP], retrieved from FRED, Federal Reserve Bank of St. Louis; https://fred.stlouisfed.org/series/GDP, .
Release Tables
- Table 1.1.5. Gross Domestic Product: Quarterly
- Table 1.2.5. Gross Domestic Product by Major Type of Product: Quarterly
- Table 1.3.5. Gross Value Added by Sector: Quarterly
- Table 1.4.5. Relation of Gross Domestic Product, Gross Domestic Purchases, and Final Sales to Domestic Purchasers: Quarterly
- Table 1.5.5. Gross Domestic Product, Expanded Detail: Quarterly
- Table 1.7.5. Relation of Gross Domestic Product, Gross National Product, Net National Product, National Income, and Personal Income: Quarterly
- Table 1.10. Gross Domestic Income by Type of Income: Quarterly
- Table 1.17.5. Gross Domestic Product, Gross Domestic Income, and Other Major NIPA Aggregates: Quarterly
- Table 5.1. Saving and Investment by Sector: Quarterly
- Table 5.2.5. Gross and Net Domestic Investment by Major Type: Quarterly
- Table 5.10. Changes in Net Stock of Produced Assets (Fixed Assets and Inventories): Quarterly
- Table 7.5. Consumption of Fixed Capital by Legal Form of Organization and Type of Income: Quarterly
- Quarterly: B.1 Derivation of U.S. Net Wealth
- B.101 Balance Sheet of Households and Nonprofit Organizations
- R.101 Change in Net Worth of Households and Nonprofit Organizations
- Quarterly: B.101.h Balance Sheet of Households
- B.101.e Balance Sheet of Households and Nonprofit Organizations with Equity Detail
- Annual Tables: S.1.a Total Economy - Current Account
- S.2.q Selected Aggregates for Total Economy and Sectors
- S.3.q Households and Nonprofit Institutions Serving Households
Related Data and Content
Data Suggestions Based On Your Search
Content Suggestions
Other Formats
All Sectors; Consumption Expenditures (IMA), Transactions
Annual, Not Seasonally Adjusted Quarterly, Not Seasonally Adjusted Quarterly, Seasonally Adjusted Annual RateHouseholds and Nonprofit Organizations; Net Worth, Level
Annual, Not Seasonally AdjustedConsumption of Fixed Capital
Annual, Not Seasonally Adjusted Millions of Dollars, Quarterly, Not Seasonally AdjustedGross Domestic Product
Annual, Not Seasonally Adjusted Annual, Not Seasonally Adjusted Index 2017=100, Quarterly, Not Seasonally Adjusted Millions of Dollars, Quarterly, Not Seasonally Adjusted Percent Change from Preceding Period, Annual, Not Seasonally Adjusted Percent Change from Preceding Period, Quarterly, Seasonally Adjusted Annual RateRelated Categories
Releases
Tags
Permalink/Embed
modal open, choose link customization options
Select automatic updates to the data or a static time frame. All data are subject to revision.


