Observations
Q4 2024: 23,400.130 | Billions of Chained 2017 Dollars, Seasonally Adjusted Annual Rate | Quarterly
Updated: Mar 27, 2025 8:03 AM CDT
Observations
Q4 2024: | 23,400.130 | |
Q3 2024: | 23,145.736 | |
Q2 2024: | 23,067.967 | |
Q1 2024: | 22,952.986 | |
Q4 2023: | 22,786.707 | |
View All |
Units:
Frequency:
Data in this graph are copyrighted. Please review the copyright information in the series notes before sharing.
Notes
Source: U.S. Bureau of Economic Analysis
Release: Gross Domestic Product
Units: Billions of Chained 2017 Dollars, Seasonally Adjusted Annual Rate
Frequency: Quarterly
Notes:
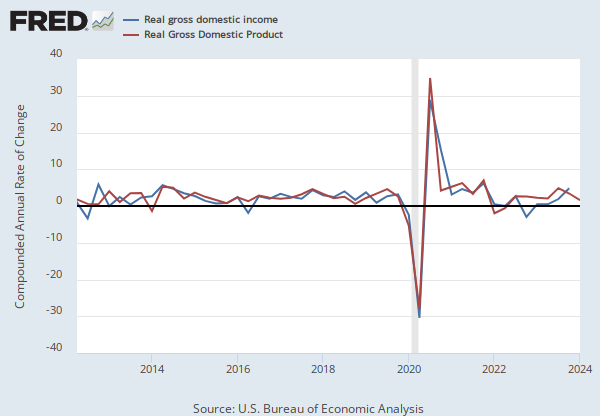
Gross domestic income is an alternative way of measuring the nation's economy, by counting the incomes earned and costs incurred in production. In theory, GDI should equal gross domestic product, but the different source data yield different results. The difference between the two measures is known as the "statistical discrepancy." BEA considers GDP more reliable because it's based on timelier, more expansive data.
BEA Account Code: A261RX
For more information about this series, please see http://www.bea.gov/national/.
Suggested Citation:
U.S. Bureau of Economic Analysis, Real gross domestic income [A261RX1Q020SBEA], retrieved from FRED, Federal Reserve Bank of St. Louis; https://fred.stlouisfed.org/series/A261RX1Q020SBEA, March 31, 2025.
Release Tables
Related Data and Content
Data Suggestions Based On Your Search
Content Suggestions
Other Formats
Related Categories
Releases
Tags
Permalink/Embed
modal open, choose link customization options
Select automatic updates to the data or a static time frame. All data are subject to revision.