Source:
Federal Reserve Bank of St. Louis
Release:
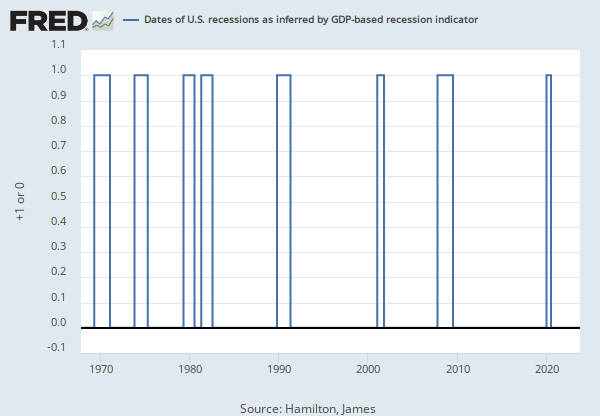
Recession Indicators Series
Units:
+1 or 0, Not Seasonally Adjusted
Frequency:
Daily, 7-Day
Notes:
This time series is an interpretation of US Business Cycle Expansions and Contractions data provided by The National Bureau of Economic Research (NBER) at http://www.nber.org/cycles/cyclesmain.html. The NBER identifies months and quarters of turning points without designating a date within the period that turning points occurred. The dummy variable adopts an arbitrary convention that the turning point occurred at a specific date within the period. The arbitrary convention does not reflect any judgment on this issue by the NBER's Business Cycle Dating Committee. Our time series is composed of dummy variables that represent periods of expansion and recession. A value of 1 is a recessionary period, while a value of 0 is an expansionary period. For this time series, the recession begins on the 15th day of the month of the peak and ends on the 15th day of the month of the trough. This time series is a disaggregation of the monthly series. For more options on recession shading, see the note and links below.
The recession shading data that we provide initially comes from the source as a list of dates that are either an economic peak or trough. We interpret dates into recession shading data using one of three arbitrary methods. All of our recession shading data is available using all three interpretations. The period between a peak and trough is always shaded as a recession. The peak and trough are collectively extrema. Depending on the application, the extrema, both individually and collectively, may be included in the recession period in whole or in part. In situations where a portion of a period is included in the recession, the whole period is deemed to be included in the recession period.
The first interpretation, known as the midpoint method, is to show a recession from the midpoint of the peak through the midpoint of the trough for monthly and quarterly data. For daily data, the recession begins on the 15th of the month of the peak and ends on the 15th of the month of the trough. Daily data is a disaggregation of monthly data. For monthly and quarterly data, the entire peak and trough periods are included in the recession shading. This method shows the maximum number of periods as a recession for monthly and quarterly data. The Federal Reserve Bank of St. Louis uses this method in its own publications. A version of this time series represented using the midpoint method can be found at:
https://fred.stlouisfed.org/series/USRECDM
The second interpretation, known as the trough method, is to show a recession from the period following the peak through the trough (i.e. the peak is not included in the recession shading, but the trough is). For daily data, the recession begins on the first day of the first month following the peak and ends on the last day of the month of the trough. Daily data is a disaggregation of monthly data. The trough method is used when displaying data on FRED graphs. The midpoint method is used for this series.
The third interpretation, known as the peak method, is to show a recession from the period of the peak to the trough (i.e. the peak is included in the recession shading, but the trough is not). For daily data, the recession begins on the first day of the month of the peak and ends on the last day of the month preceding the trough. Daily data is a disaggregation of monthly data. A version of this time series represented using the peak method can be found at:
https://fred.stlouisfed.org/series/USRECDP
Suggested Citation:
Federal Reserve Bank of St. Louis,
NBER based Recession Indicators for the United States from the Period following the Peak through the Trough [USRECD],
retrieved from FRED,
Federal Reserve Bank of St. Louis;
https://fred.stlouisfed.org/series/USRECD,
.