Notes
Source: Federal Reserve Bank of Atlanta
Release: Sticky Price CPI
Units:
Frequency:
Notes:
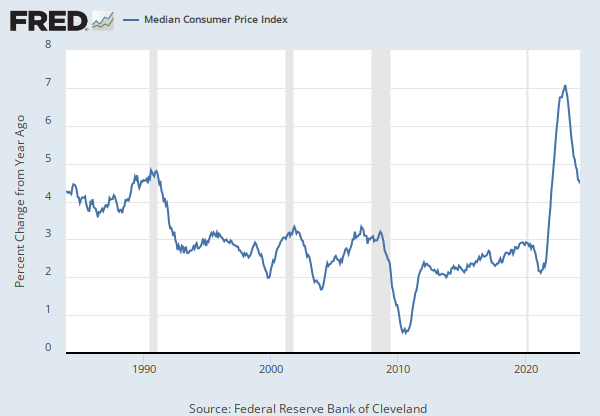
The Sticky Price Consumer Price Index (CPI) is calculated from a subset of goods and services included in the CPI that change price relatively infrequently. Because these goods and services change price relatively infrequently, they are thought to incorporate expectations about future inflation to a greater degree than prices that change on a more frequent basis. One possible explanation for sticky prices could be the costs firms incur when changing price.
To obtain more information about this release see: Michael F. Bryan, and Brent H. Meyer. “Are Some Prices in the CPI More Forward Looking Than Others? We Think So.” Economic Commentary (Federal Reserve Bank of Cleveland) (May 19, 2010): 1–6. https://doi.org/10.26509/frbc-ec-201002.
Suggested Citation:
Federal Reserve Bank of Atlanta, Sticky Price Consumer Price Index [STICKCPIM159SFRBATL], retrieved from FRED, Federal Reserve Bank of St. Louis; https://fred.stlouisfed.org/series/STICKCPIM159SFRBATL, .
Source: U.S. Bureau of Labor Statistics
Release: Consumer Price Index
Units:
Frequency:
Notes:
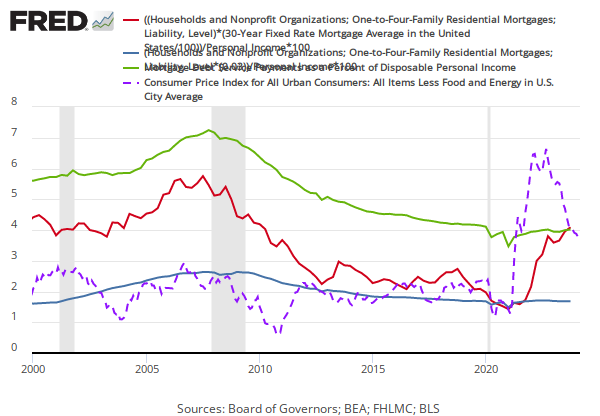
The "Consumer Price Index for All Urban Consumers: All Items Less Food & Energy" is an aggregate of prices paid by urban consumers for a typical basket of goods, excluding food and energy. This measurement, known as "Core CPI," is widely used by economists because food and energy have very volatile prices. The Bureau of Labor Statistics defines and measures the official CPI, and more information can be found in the FAQ or in this article.
Suggested Citation:
U.S. Bureau of Labor Statistics, Consumer Price Index for All Urban Consumers: All Items Less Food and Energy in U.S. City Average [CPILFESL], retrieved from FRED, Federal Reserve Bank of St. Louis; https://fred.stlouisfed.org/series/CPILFESL, .
Release Tables
Consumer Price Index
Related Data and Content
Data Suggestions Based On Your Search


Content Suggestions


Other Formats
Sticky Price Consumer Price Index
3-Month Annualized Percent Change, Monthly, Seasonally Adjusted Percent Change, Monthly, Seasonally Adjusted Percent Change at Annual Rate, Monthly, Seasonally AdjustedConsumer Price Index for All Urban Consumers: All Items Less Food and Energy in U.S. City Average
Monthly, Not Seasonally Adjusted Semiannual, Not Seasonally Adjusted