Notes
Source: U.S. Bureau of Labor Statistics
Release: Consumer Price Index
Units:
Frequency:
Notes:
The Consumer Price Index for All Urban Consumers: All Items (CPIAUCSL) is a price index of a basket of goods and services paid by urban consumers. Percent changes in the price index measure the inflation rate between any two time periods. The most common inflation metric is the percent change from one year ago. It can also represent the buying habits of urban consumers. This particular index includes roughly 88 percent of the total population, accounting for wage earners, clerical workers, technical workers, self-employed, short-term workers, unemployed, retirees, and those not in the labor force.
The CPIs are based on prices for food, clothing, shelter, and fuels; transportation fares; service fees (e.g., water and sewer service); and sales taxes. Prices are collected monthly from about 4,000 housing units and approximately 26,000 retail establishments across 87 urban areas. To calculate the index, price changes are averaged with weights representing their importance in the spending of the particular group. The index measures price changes (as a percent change) from a predetermined reference date. In addition to the original unadjusted index distributed, the Bureau of Labor Statistics also releases a seasonally adjusted index. The unadjusted series reflects all factors that may influence a change in prices. However, it can be very useful to look at the seasonally adjusted CPI, which removes the effects of seasonal changes, such as weather, school year, production cycles, and holidays.
The CPI can be used to recognize periods of inflation and deflation. Significant increases in the CPI within a short time frame might indicate a period of inflation, and significant decreases in CPI within a short time frame might indicate a period of deflation. However, because the CPI includes volatile food and oil prices, it might not be a reliable measure of inflationary and deflationary periods. For a more accurate detection, the core CPI (CPILFESL) is often used. When using the CPI, please note that it is not applicable to all consumers and should not be used to determine relative living costs. Additionally, the CPI is a statistical measure vulnerable to sampling error since it is based on a sample of prices and not the complete average.
For more information on the CPI, see the Handbook of Methods, the release notes and announcements, and the Frequently Asked Questions (FAQs).
Suggested Citation:
U.S. Bureau of Labor Statistics, Consumer Price Index for All Urban Consumers: All Items in U.S. City Average [CPIAUCSL], retrieved from FRED, Federal Reserve Bank of St. Louis; https://fred.stlouisfed.org/series/CPIAUCSL, .
Source: Board of Governors of the Federal Reserve System (US)
Release: H.15 Selected Interest Rates
Units:
Frequency:
Notes:
For further information regarding treasury constant maturity data, please refer to the H.15 Statistical Release notes and the Treasury Yield Curve Methodology.
For questions on the data, please contact the data source. For questions on FRED functionality, please contact us here.
Suggested Citation:
Board of Governors of the Federal Reserve System (US), Market Yield on U.S. Treasury Securities at 2-Year Constant Maturity, Quoted on an Investment Basis [DGS2], retrieved from FRED, Federal Reserve Bank of St. Louis; https://fred.stlouisfed.org/series/DGS2, .
Source: Board of Governors of the Federal Reserve System (US)
Release: H.15 Selected Interest Rates
Units:
Frequency:
Notes:
For further information regarding treasury constant maturity data, please refer to the H.15 Statistical Release notes and Treasury Yield Curve Methodology.
For questions on the data, please contact the data source. For questions on FRED functionality, please contact us here.
Suggested Citation:
Board of Governors of the Federal Reserve System (US), Market Yield on U.S. Treasury Securities at 10-Year Constant Maturity, Quoted on an Investment Basis [DGS10], retrieved from FRED, Federal Reserve Bank of St. Louis; https://fred.stlouisfed.org/series/DGS10, .
Source: Ice Data Indices, LLC
Release: ICE BofA Indices
Units:
Frequency:
Notes:
Starting in April 2026, this series will only include 3 years of observations. For more data, go to the source.
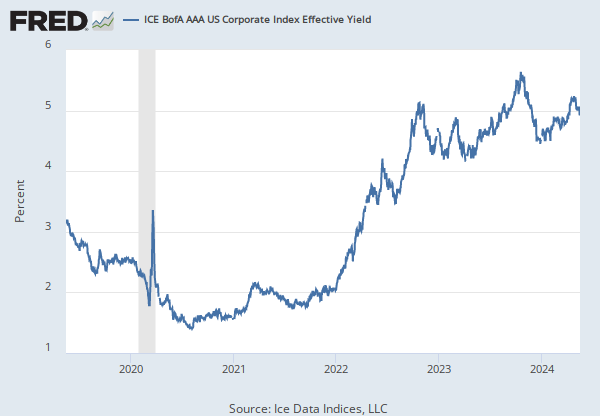
This data represents the effective yield of the ICE BofA US Corporate Index, which tracks the performance of US dollar denominated investment grade rated corporate debt publicly issued in the US domestic market. To qualify for inclusion in the index, securities must have an investment grade rating (based on an average of Moody's, S&P, and Fitch) and an investment grade rated country of risk (based on an average of Moody's, S&P, and Fitch foreign currency long term sovereign debt ratings). Each security must have greater than 1 year of remaining maturity, a fixed coupon schedule, and a minimum amount outstanding of $250 million. Original issue zero coupon bonds, "global" securities (debt issued simultaneously in the eurobond and US domestic bond markets), 144a securities and pay-in-kind securities, including toggle notes, qualify for inclusion in the Index. Callable perpetual securities qualify provided they are at least one year from the first call date. Fixed-to-floating rate securities also qualify provided they are callable within the fixed rate period and are at least one year from the last call prior to the date the bond transitions from a fixed to a floating rate security. DRD-eligible and defaulted securities are excluded from the Index.
ICE BofA Explains the Construction Methodology of this series as:
Index constituents are capitalization-weighted based on their current amount outstanding. With the exception of U.S. mortgage pass-throughs and U.S. structured products (ABS, CMBS and CMOs), accrued interest is calculated assuming next-day settlement. Accrued interest for U.S. mortgage pass-through and U.S. structured products is calculated assuming same-day settlement. Cash flows from bond payments that are received during the month are retained in the index until the end of the month and then are removed as part of the rebalancing. Cash does not earn any reinvestment income while it is held in the Index. The Index is rebalanced on the last calendar day of the month, based on information available up to and including the third business day before the last business day of the month. Issues that meet the qualifying criteria are included in the Index for the following month. Issues that no longer meet the criteria during the course of the month remain in the Index until the next month-end rebalancing at which point they are removed from the Index.
When the last calendar day of the month takes place on the weekend, weekend observations will occur as a result of month ending accrued interest adjustments.
Certain indices and index data included in FRED are the property of ICE Data Indices, LLC (“ICE DATA”) and used under license. ICE® IS A REGISTERED TRADEMARK OF ICE DATA OR ITS AFFILIATES AND BOFA® IS A REGISTERED TRADEMARK OF BANK OF AMERICA CORPORATION LICENSED BY BANK OF AMERICA CORPORATION AND ITS AFFILIATES (“BOFA”) AND MAY NOT BE USED WITHOUT BOFA’S PRIOR WRITTEN APPROVAL. ICE DATA, ITS AFFILIATES AND THEIR RESPECTIVE THIRD PARTY SUPPLIERS DISCLAIM ANY AND ALL WARRANTIES AND REPRESENTATIONS, EXPRESS AND/OR IMPLIED, INCLUDING ANY WARRANTIES OF MERCHANTABILITY OR FITNESS FOR A PARTICULAR PURPOSE OR USE, INCLUDING WITH REGARD TO THE INDICES, INDEX DATA AND ANY DATA INCLUDED IN, RELATED TO, OR DERIVED THEREFROM. NEITHER ICE DATA, NOR ITS AFFILIATES OR THEIR RESPECTIVE THIRD PARTY PROVIDERS SHALL BE SUBJECT TO ANY DAMAGES OR LIABILITY WITH RESPECT TO THE ADEQUACY, ACCURACY, TIMELINESS OR COMPLETENESS OF THE INDICES OR THE INDEX DATA OR ANY COMPONENT THEREOF. THE INDICES AND INDEX DATA AND ALL COMPONENTS THEREOF ARE PROVIDED ON AN “AS IS” BASIS AND YOUR USE IS AT YOUR OWN RISK. ICE DATA, ITS AFFILIATES AND THEIR RESPECTIVE THIRD PARTY SUPPLIERS DO NOT SPONSOR, ENDORSE, OR RECOMMEND FRED, OR ANY OF ITS PRODUCTS OR SERVICES.
Copyright, 2023, ICE Data Indices. Reproduction of this data in any form is prohibited except with the prior written permission of ICE Data Indices.
The end of day Index values, Index returns, and Index statistics (“Top Level Data”) are being provided for your internal use only and you are not authorized or permitted to publish, distribute or otherwise furnish Top Level Data to any third-party without prior written approval of ICE Data.
Neither ICE Data, its affiliates nor any of its third party suppliers shall have any liability for the accuracy or completeness of the Top Level Data furnished through FRED, or for delays, interruptions or omissions therein nor for any lost profits, direct, indirect, special or consequential damages.
The Top Level Data is not investment advice and a reference to a particular investment or security, a credit rating or any observation concerning a security or investment provided in the Top Level Data is not a recommendation to buy, sell or hold such investment or security or make any other investment decisions.
You shall not use any Indices as a reference index for the purpose of creating financial products (including but not limited to any exchange-traded fund or other passive index-tracking fund, or any other financial instrument whose objective or return is linked in any way to any Index) without prior written approval of ICE Data.
ICE Data, their affiliates or their third party suppliers have exclusive proprietary rights in the Top Level Data and any information and software received in connection therewith.
You shall not use or permit anyone to use the Top Level Data for any unlawful or unauthorized purpose.
Access to the Top Level Data is subject to termination in the event that any agreement between FRED and ICE Data terminates for any reason.
ICE Data may enforce its rights against you as the third-party beneficiary of the FRED Services Terms of Use, even though ICE Data is not a party to the FRED Services Terms of Use.
The FRED Services Terms of Use, including but limited to the limitation of liability, indemnity and disclaimer provisions, shall extend to third party suppliers.
Suggested Citation:
Ice Data Indices, LLC, ICE BofA US Corporate Index Effective Yield [BAMLC0A0CMEY], retrieved from FRED, Federal Reserve Bank of St. Louis; https://fred.stlouisfed.org/series/BAMLC0A0CMEY, .
Source: Freddie Mac
Release: Primary Mortgage Market Survey
Units:
Frequency:
Notes:
On November 17, 2022, Freddie Mac changed the methodology of the Primary Mortgage Market Survey® (PMMS®). The weekly mortgage rate is now based on applications submitted to Freddie Mac from lenders across the country. For more information regarding Freddie Mac’s enhancement, see their research note.
Data are provided “as is” by Freddie Mac®, with no warranties of any kind, express or implied, including but not limited to warranties of accuracy or implied warranties of merchantability or fitness for a particular purpose. Use of the data is at the user’s sole risk. In no event will Freddie Mac be liable for any damages arising out of or related to the data, including but not limited to direct, indirect, incidental, special, consequential, or punitive damages, whether under a contract, tort, or any other theory of liability, even if Freddie Mac is aware of the possibility of such damages.
Copyright, 2016, Freddie Mac. Reprinted with permission.
Suggested Citation:
Freddie Mac, 30-Year Fixed Rate Mortgage Average in the United States [MORTGAGE30US], retrieved from FRED, Federal Reserve Bank of St. Louis; https://fred.stlouisfed.org/series/MORTGAGE30US, .
Release Tables
Consumer Price Index
H.15 Selected Interest Rates
Primary Mortgage Market Survey
Related Data and Content
Data Suggestions Based On Your Search


Content Suggestions


Other Formats
Consumer Price Index for All Urban Consumers: All Items in U.S. City Average
Monthly, Not Seasonally Adjusted Semiannual, Not Seasonally AdjustedMarket Yield on U.S. Treasury Securities at 2-Year Constant Maturity, Quoted on an Investment Basis
Annual, Not Seasonally Adjusted Monthly, Not Seasonally Adjusted Weekly, Not Seasonally AdjustedMarket Yield on U.S. Treasury Securities at 10-Year Constant Maturity, Quoted on an Investment Basis
Annual, Not Seasonally Adjusted Monthly, Not Seasonally Adjusted Weekly, Not Seasonally AdjustedRelated Categories
Consumer Price Indexes (CPI and PCE)
Prices
Treasury Constant Maturity
Interest Rates
Money, Banking, & Finance
Corporate Bonds
Mortgage Rates
Releases
More
Series from Consumer Price Index
More
Series from H.15 Selected Interest Rates
More
Series from ICE BofA Indices
More
Series from Primary Mortgage Market Survey
Tags
Headline Figure
Average
All Items
Urban
Consumer
Consumer Price Index
Inflation
Price Index
Indexes
Seasonally Adjusted
Price
Bureau of Labor Statistics
Monthly
Nation
Public Domain: Citation Requested
United States of America
2-Year
Maturity
H.15 Selected Interest Rates
Treasury
Interest Rate
Interest
Daily
Board of Governors
Rate
Not Seasonally Adjusted
10-Year
BofA Merrill Lynch
BofA Merrill Lynch
Ice Data Indices, Llc
Yield
Corporate
Copyrighted: Pre-Approval Required
Freddie Mac
30-Year
Mortgage
Fixed
Weekly
Copyrighted: Citation Required