Federal Reserve Economic Data

FRED Graph

1Y5Y10YMax
to
Date:
Line 1 - Federal Surplus or Deficit [-] as Percent of Gross Domestic Product
Line 1
(a) Federal Surplus or Deficit [-] as Percent of Gross Domestic Product, Percent of GDP, Not Seasonally Adjusted (FYFSGDA188S)
Federal Surplus or Deficit [-] as Percent of Gross Domestic Product (FYFSGDA188S) (https://fred.stlouisfed.org/series/FYFSGDA188S) was first constructed by the Federal Reserve Bank of St. Louis in October 2012. It is calculated using Federal Surplus or Deficit [-] (FYFSD) (https://fred.stlouisfed.org/series/FYFSD) and Gross Domestic Product (GDPA) (https://fred.stlouisfed.org/series/GDPA): FYFSGDA188S = ((FYFSD/1000)/GDPA)*100 FYFSD/1000 transforms FYFSD from millions of dollars to billions of dollars.

Select a date that will equal 100 for your custom index:
  Enter date as YYYY-MM-DD
to

Write a custom formula to transform one or more series or combine two or more series.

You can begin by adding a series to combine with your existing series.

Type keywords to search for data

    Now create a custom formula to combine or transform the series.

    For example, invert an exchange rate by using formula 1/a, where “a” refers to the first FRED data series added to this line. Or calculate the spread between 2 interest rates, a and b, by using the formula a - b.

    Use the assigned data series variables (a, b, c, etc.) together with operators (+, -, *, /, ^, etc.), parentheses and constants (1, 1.5, 2, etc.) to create your own formula (e.g., 1/a, a-b, (a+b)/2, (a/(a+b+c))*100). As noted above, you may add other data series to this line before entering a formula.

    Finally, you can change the units of your new series.

    Select a date that will equal 100 for your custom index:
        Enter date as YYYY-MM-DD

    Line 1 - Federal Surplus or Deficit [-] as Percent of Gross Domestic Product
    Line 2
    (a) Shares of gross domestic product: Net exports of goods and services, Percent, Not Seasonally Adjusted (A019RE1Q156NBEA)
    BEA Account Code: A019RE For more information about this series, please see http://www.bea.gov/national/.

    Select a date that will equal 100 for your custom index:
      Enter date as YYYY-MM-DD
    to

    Write a custom formula to transform one or more series or combine two or more series.

    You can begin by adding a series to combine with your existing series.

    Type keywords to search for data

      Now create a custom formula to combine or transform the series.

      For example, invert an exchange rate by using formula 1/a, where “a” refers to the first FRED data series added to this line. Or calculate the spread between 2 interest rates, a and b, by using the formula a - b.

      Use the assigned data series variables (a, b, c, etc.) together with operators (+, -, *, /, ^, etc.), parentheses and constants (1, 1.5, 2, etc.) to create your own formula (e.g., 1/a, a-b, (a+b)/2, (a/(a+b+c))*100). As noted above, you may add other data series to this line before entering a formula.

      Finally, you can change the units of your new series.

      Select a date that will equal 100 for your custom index:
          Enter date as YYYY-MM-DD

      ADDLINE
      Type keywords to search for data
      Create user-defined line
      You can customize a graph by adding a straight line between two data points.
      FORMAT GRAPH
      Details
      Display
      Customize
      Frame
      Plot area
      Text

      Line 1
      Federal Surplus or Deficit [-] as Percent of Gross Domestic Product
      Line details & color

      Line style, thickness, color and position


      Line 2
      Shares of gross domestic product: Net exports of goods and services
      Line details & color

      Line style, thickness, color and position


      Fullscreen

      Notes

      Source: U.S. Office of Management and Budget  

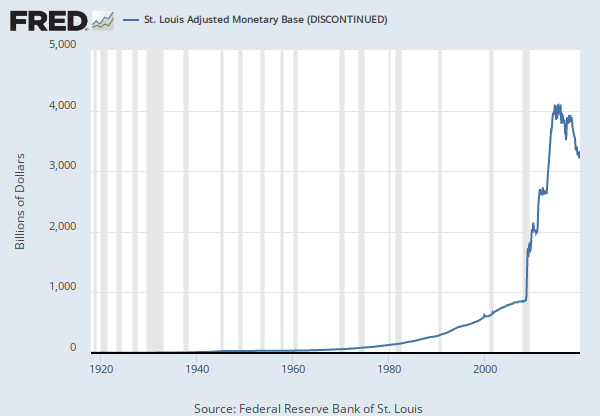
      Source: Federal Reserve Bank of St. Louis  

      Release: Debt to Gross Domestic Product Ratios

      Units:  Percent of GDP, Not Seasonally Adjusted

      Frequency:  Annual

      Notes:

      Federal Surplus or Deficit [-] as Percent of Gross Domestic Product (FYFSGDA188S) was first constructed by the Federal Reserve Bank of St. Louis in October 2012. It is calculated using Federal Surplus or Deficit [-] (FYFSD) and Gross Domestic Product (GDPA):
      FYFSGDA188S = ((FYFSD/1000)/GDPA)*100
      FYFSD/1000 transforms FYFSD from millions of dollars to billions of dollars.

      Suggested Citation:

      U.S. Office of Management and Budget and Federal Reserve Bank of St. Louis, Federal Surplus or Deficit [-] as Percent of Gross Domestic Product [FYFSGDA188S], retrieved from FRED, Federal Reserve Bank of St. Louis; https://fred.stlouisfed.org/series/FYFSGDA188S, April 15, 2025.

      Source: U.S. Bureau of Economic Analysis  

      Release: Gross Domestic Product  

      Units:  Percent, Not Seasonally Adjusted

      Frequency:  Quarterly

      Notes:

      BEA Account Code: A019RE

      For more information about this series, please see http://www.bea.gov/national/.

      Suggested Citation:

      U.S. Bureau of Economic Analysis, Shares of gross domestic product: Net exports of goods and services [A019RE1Q156NBEA], retrieved from FRED, Federal Reserve Bank of St. Louis; https://fred.stlouisfed.org/series/A019RE1Q156NBEA, April 15, 2025.

      Related Data and Content

      Data Suggestions Based On Your Search

      Content Suggestions

      Other Formats

      Federal Surplus or Deficit [-] as Percent of Gross Domestic Product

      Annual, Not Seasonally Adjusted

      Shares of gross domestic product: Net exports of goods and services

      Annual, Not Seasonally Adjusted

      Related Categories

      Releases

      Tags


      Subscribe to the FRED newsletter


      Follow us

      Back to Top
      Color format