Notes
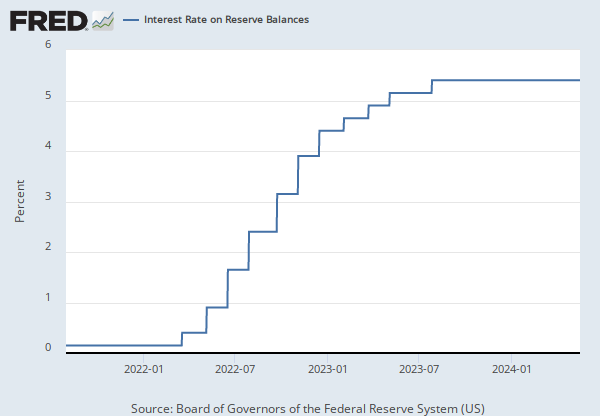
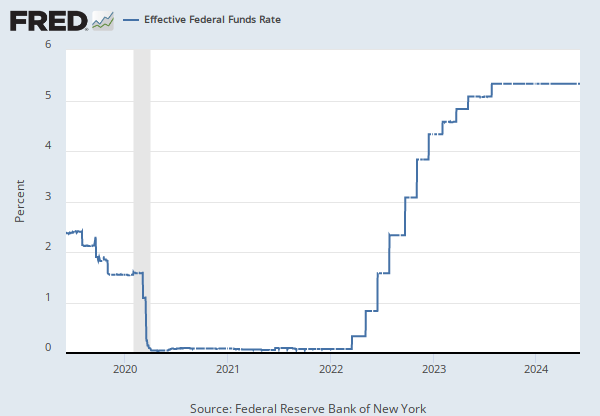
Source: Board of Governors of the Federal Reserve System (US)
Release: H.15 Selected Interest Rates
Units:
Frequency:
Notes:
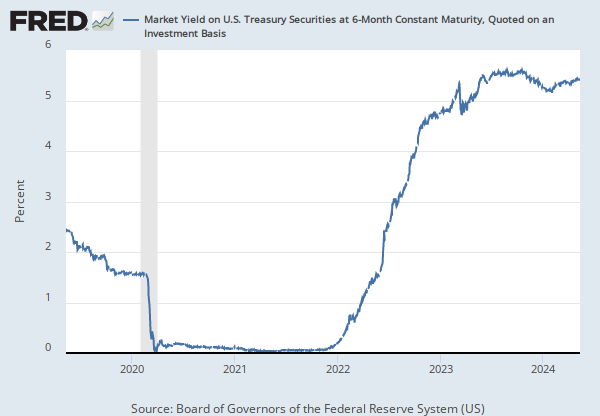
For further information regarding treasury constant maturity data, please refer to the H.15 Statistical Release notes and the Treasury Yield Curve Methodology.
For questions on the data, please contact the data source. For questions on FRED functionality, please contact us here.
Suggested Citation:
Board of Governors of the Federal Reserve System (US), Market Yield on U.S. Treasury Securities at 1-Year Constant Maturity, Quoted on an Investment Basis [DGS1], retrieved from FRED, Federal Reserve Bank of St. Louis; https://fred.stlouisfed.org/series/DGS1, .
Source: Board of Governors of the Federal Reserve System (US)
Release: H.15 Selected Interest Rates
Units:
Frequency:
Notes:
For further information regarding treasury constant maturity data, please refer to the H.15 Statistical Release notes and the Treasury Yield Curve Methodology.
For questions on the data, please contact the data source. For questions on FRED functionality, please contact us here.
Suggested Citation:
Board of Governors of the Federal Reserve System (US), Market Yield on U.S. Treasury Securities at 2-Year Constant Maturity, Quoted on an Investment Basis [DGS2], retrieved from FRED, Federal Reserve Bank of St. Louis; https://fred.stlouisfed.org/series/DGS2, .
Source: Board of Governors of the Federal Reserve System (US)
Release: H.15 Selected Interest Rates
Units:
Frequency:
Notes:
For further information regarding treasury constant maturity data, please refer to the H.15 Statistical Release notes and Treasury Yield Curve Methodology.
For questions on the data, please contact the data source. For questions on FRED functionality, please contact us here.
Suggested Citation:
Board of Governors of the Federal Reserve System (US), Market Yield on U.S. Treasury Securities at 10-Year Constant Maturity, Quoted on an Investment Basis [DGS10], retrieved from FRED, Federal Reserve Bank of St. Louis; https://fred.stlouisfed.org/series/DGS10, .
Source: Board of Governors of the Federal Reserve System (US)
Release: H.15 Selected Interest Rates
Units:
Frequency:
Notes:
Yields on actively traded non-inflation-indexed issues adjusted to constant maturities. The 30-year Treasury constant maturity series was discontinued on February 18, 2002, and reintroduced on February 9, 2006.
For further information regarding treasury constant maturity data, please refer to the H.15 Statistical Release notes and the Treasury Yield Curve Methodology.
For questions on the data, please contact the data source. For questions on FRED functionality, please contact us here.
Suggested Citation:
Board of Governors of the Federal Reserve System (US), Market Yield on U.S. Treasury Securities at 30-Year Constant Maturity, Quoted on an Investment Basis [DGS30], retrieved from FRED, Federal Reserve Bank of St. Louis; https://fred.stlouisfed.org/series/DGS30, .
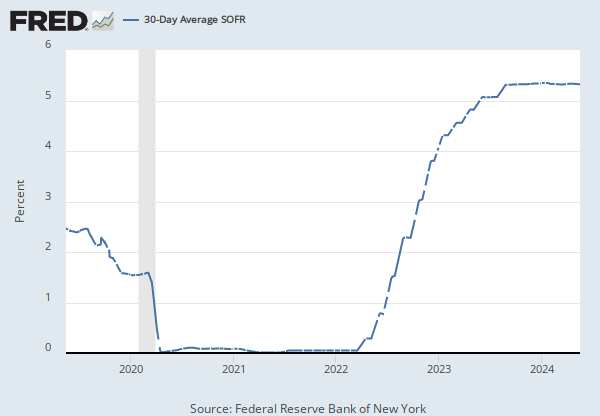
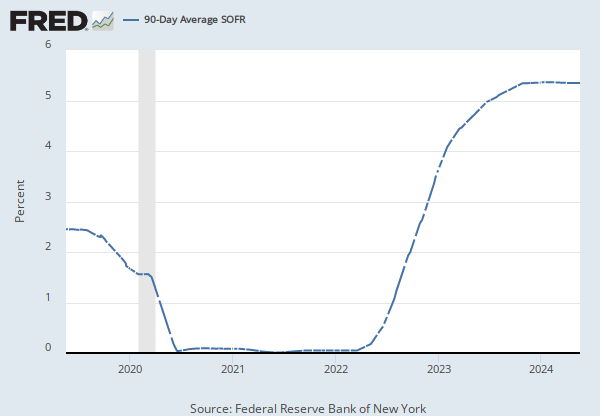
Source: Federal Reserve Bank of New York
Release: Secured Overnight Financing Rate Data
Units:
Frequency:
Suggested Citation:
Federal Reserve Bank of New York, Secured Overnight Financing Rate [SOFR], retrieved from FRED, Federal Reserve Bank of St. Louis; https://fred.stlouisfed.org/series/SOFR, .
Source: U.S. Bureau of Labor Statistics
Release: Consumer Price Index
Units:
Frequency:
Notes:
The “Consumer Price Index for All Urban Consumers: All Items Less Food & Energy” is an aggregate of prices paid by urban consumers for a typical basket of goods, excluding food and energy. This measurement, known as “Core CPI,” is widely used by economists because food and energy have very volatile prices. The Bureau of Labor Statistics defines and measures the official CPI, and more information can be found here: https://www.bls.gov/cpi/questions-and-answers.htm or here: https://www.bls.gov/opub/hom/pdf/cpihom.pdf.
Suggested Citation:
U.S. Bureau of Labor Statistics, Consumer Price Index for All Urban Consumers: All Items Less Food and Energy in U.S. City Average [CPILFENS], retrieved from FRED, Federal Reserve Bank of St. Louis; https://fred.stlouisfed.org/series/CPILFENS, .
Source: U.S. Bureau of Economic Analysis
Release: Personal Income and Outlays
Units:
Frequency:
Notes:
BEA Account Code: DPCCRG
The Personal Consumption Expenditures Price Index is a measure of the prices that people living in the United States, or those buying on their behalf, pay for goods and services. The change in the PCE price index is known for capturing inflation (or deflation) across a wide range of consumer expenses and reflecting changes in consumer behavior. For example, if car prices rise, car sales may decline while bicycle sales increase.
The PCE Price Index is produced by the Bureau of Economic Analysis (BEA), which revises previously published PCE data to reflect updated information or new methodology, providing consistency across decades of data that's valuable for researchers. They also offer the series as a Chain-Type index and excluding food and energy products, as above. The PCE price index less food excluding food and energy is used primarily for macroeconomic analysis and forecasting future values of the PCE price index.
The PCE Price Index is similar to the Bureau of Labor Statistics' consumer price index for urban consumers. The two indexes, which have their own purposes and uses, are constructed differently, resulting in different inflation rates.
For more information on the PCE price index, see:
U.S. Bureau of Economic Analysis, Guide to the National Income and Product Accounts of the United States (NIPA)
U.S. Bureau of Economic Analysis, Personal Consumption Expenditures Price Index
U.S. Bureau of Economic Analysis, Prices & Inflation
U.S. Bureau of Labor Statistics, Differences between the Consumer Price Index and the Personal Consumption Expenditure Price Index
Suggested Citation:
U.S. Bureau of Economic Analysis, Personal Consumption Expenditures Excluding Food and Energy (Chain-Type Price Index) [PCEPILFE], retrieved from FRED, Federal Reserve Bank of St. Louis; https://fred.stlouisfed.org/series/PCEPILFE, .
Release Tables
Consumer Price Index
H.15 Selected Interest Rates
Personal Income and Outlays
Secured Overnight Financing Rate Data
Related Data and Content
Data Suggestions Based On Your Search


Content Suggestions


Other Formats
Market Yield on U.S. Treasury Securities at 1-Year Constant Maturity, Quoted on an Investment Basis
Annual, Not Seasonally Adjusted Monthly, Not Seasonally Adjusted Weekly, Not Seasonally AdjustedMarket Yield on U.S. Treasury Securities at 2-Year Constant Maturity, Quoted on an Investment Basis
Annual, Not Seasonally Adjusted Monthly, Not Seasonally Adjusted Weekly, Not Seasonally AdjustedMarket Yield on U.S. Treasury Securities at 10-Year Constant Maturity, Quoted on an Investment Basis
Annual, Not Seasonally Adjusted Monthly, Not Seasonally Adjusted Weekly, Not Seasonally AdjustedMarket Yield on U.S. Treasury Securities at 30-Year Constant Maturity, Quoted on an Investment Basis
Annual, Not Seasonally Adjusted Monthly, Not Seasonally Adjusted Weekly, Not Seasonally AdjustedConsumer Price Index for All Urban Consumers: All Items Less Food and Energy in U.S. City Average
Monthly, Seasonally Adjusted Semiannual, Not Seasonally AdjustedPersonal Consumption Expenditures Excluding Food and Energy (Chain-Type Price Index)
Percent Change from Quarter One Year Ago, Quarterly, Seasonally AdjustedRelated Categories
Treasury Constant Maturity
Interest Rates
Money, Banking, & Finance
FRB Rates - discount, fed funds, primary credit
Special Indexes
Consumer Price Indexes (CPI and PCE)
Prices
Price Indexes & Deflators
National Income & Product Accounts
National Accounts
Releases
More
Series from H.15 Selected Interest Rates
More
Series from Secured Overnight Financing Rate Data
More
Series from Consumer Price Index
More
Series from Personal Income and Outlays
Tags
1-Year
Maturity
H.15 Selected Interest Rates
Treasury
Interest Rate
Interest
Daily
Board of Governors
Rate
Nation
Public Domain: Citation Requested
United States of America
Not Seasonally Adjusted
2-Year
10-Year
30-Year
Financing
Overnight
New York Fed
Securities
Copyrighted: Citation Required
Core Inflation
All Items
Urban
Consumer
Consumer Price Index
Inflation
Price Index
Indexes
Price
Bureau of Labor Statistics
Monthly
Chained
Headline Figure
Energy
Personal Consumption Expenditures
Consumption Expenditures
Consumption
Personal
National Income and Product Accounts
Bureau of Economic Analysis
Seasonally Adjusted