Notes
Source: U.S. Bureau of Economic Analysis
Release: Gross Domestic Product
Units:
Frequency:
Notes:
BEA Account Code: A455RC
For more information about this series, please see http://www.bea.gov/national/.
Suggested Citation:
U.S. Bureau of Economic Analysis, Gross value added of nonfinancial corporate business [A455RC1Q027SBEA], retrieved from FRED, Federal Reserve Bank of St. Louis; https://fred.stlouisfed.org/series/A455RC1Q027SBEA, .
Source: U.S. Bureau of Economic Analysis
Release: Gross Domestic Product
Units:
Frequency:
Notes:
BEA Account Code: A464RC
For more information about this series, please see http://www.bea.gov/national/.
Suggested Citation:
U.S. Bureau of Economic Analysis, Nonfinancial corporate business: Profits before tax (without IVA and CCAdj) [A464RC1Q027SBEA], retrieved from FRED, Federal Reserve Bank of St. Louis; https://fred.stlouisfed.org/series/A464RC1Q027SBEA, .
Source: U.S. Bureau of Economic Analysis
Release: Gross Domestic Product
Units:
Frequency:
Notes:
BEA Account Code: A454RC
For more information about this series, please see http://www.bea.gov/national/.
Suggested Citation:
U.S. Bureau of Economic Analysis, Gross value added of financial corporate business [A454RC1Q027SBEA], retrieved from FRED, Federal Reserve Bank of St. Louis; https://fred.stlouisfed.org/series/A454RC1Q027SBEA, .
Source: Board of Governors of the Federal Reserve System (US)
Release: Z.1 Financial Accounts of the United States
Units:
Frequency:
Notes:
For more information about the Flow of Funds tables, see the Financial Accounts Guide.
With each quarterly release, the source may make major data and structural revisions to the series and tables. These changes are available in the Release Highlights.
In the Financial Accounts, the source identifies each series by a string of patterned letters and numbers. For a detailed description, including how this series is constructed, see the series analyzer provided by the source.
Suggested Citation:
Board of Governors of the Federal Reserve System (US), Domestic Financial Sectors; Corporate Profits Before Tax Excluding IVA and CCAdj, Transactions [BOGZ1FA796060005Q], retrieved from FRED, Federal Reserve Bank of St. Louis; https://fred.stlouisfed.org/series/BOGZ1FA796060005Q, .
Source: Board of Governors of the Federal Reserve System (US)
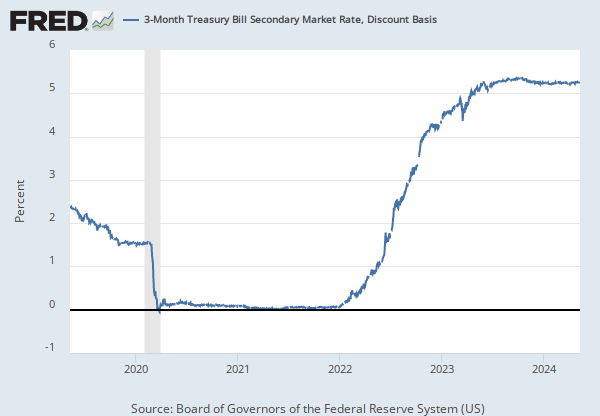
Release: H.15 Selected Interest Rates
Units:
Frequency:
Notes:
Averages of Business Days, Discount Basis
For questions on the data, please contact the data source. For questions on FRED functionality, please contact us here.
Suggested Citation:
Board of Governors of the Federal Reserve System (US), 3-Month Treasury Bill Secondary Market Rate, Discount Basis [TB3MS], retrieved from FRED, Federal Reserve Bank of St. Louis; https://fred.stlouisfed.org/series/TB3MS, .
Source: U.S. Bureau of Economic Analysis
Release: Personal Income and Outlays
Units:
Frequency:
Notes:
BEA Account Code: DPCERG
The Personal Consumption Expenditures Price Index is a measure of the prices that people living in the United States, or those buying on their behalf, pay for goods and services. The change in the PCE price index is known for capturing inflation (or deflation) across a wide range of consumer expenses and reflecting changes in consumer behavior. For example, if the price of beef rises, shoppers may buy less beef and more chicken.
The PCE Price Index is produced by the Bureau of Economic Analysis (BEA), which revises previously published PCE data to reflect updated information or new methodology, providing consistency across decades of data that's valuable for researchers. They also offer the series as a Chain-Type index, as above. The PCE price index is used primarily for macroeconomic analysis and forecasting.
The PCE Price index is the Federal Reserve’s preferred measure of inflation. The PCE Price Index is similar to the Bureau of Labor Statistics' consumer price index for urban consumers. The two indexes, which have their own purposes and uses, are constructed differently, resulting in different inflation rates.
For more information on the PCE price index, see:
U.S. Bureau of Economic Analysis, Guide to the National Income and Product Accounts of the United States (NIPA)
U.S. Bureau of Economic Analysis, Personal Consumption Expenditures Price Index
U.S. Bureau of Economic Analysis, Prices & Inflation
U.S. Bureau of Labor Statistics, Differences between the Consumer Price Index and the Personal Consumption Expenditure Price Index
Suggested Citation:
U.S. Bureau of Economic Analysis, Personal Consumption Expenditures: Chain-type Price Index [PCEPI], retrieved from FRED, Federal Reserve Bank of St. Louis; https://fred.stlouisfed.org/series/PCEPI, .
Release Tables
Gross Domestic Product
H.15 Selected Interest Rates
Personal Income and Outlays
Z.1 Financial Accounts of the United States
Related Data and Content
Data Suggestions Based On Your Search


Content Suggestions


Other Formats
Gross value added of nonfinancial corporate business
Annual, Not Seasonally AdjustedNonfinancial corporate business: Profits before tax (without IVA and CCAdj)
Annual, Not Seasonally AdjustedGross value added of financial corporate business
Annual, Not Seasonally AdjustedDomestic Financial Sectors; Corporate Profits Before Tax Excluding IVA and CCAdj, Transactions
Annual, Not Seasonally Adjusted Annual, Seasonally Adjusted Annual Rate Quarterly, Not Seasonally Adjusted3-Month Treasury Bill Secondary Market Rate, Discount Basis
Annual, Not Seasonally Adjusted Daily, Not Seasonally Adjusted Weekly, Not Seasonally AdjustedPersonal Consumption Expenditures: Chain-type Price Index
Annual, Not Seasonally Adjusted Quarterly, Seasonally AdjustedRelated Categories
Private Enterprise Income
National Income & Product Accounts
National Accounts
GDP/GNP
Flow of Funds
Treasury Bills
Interest Rates
Money, Banking, & Finance
Consumer Price Indexes (CPI and PCE)
Prices
Price Indexes & Deflators
Releases
More
Series from Gross Domestic Product
More
Series from Z.1 Financial Accounts of the United States
More
Series from H.15 Selected Interest Rates
More
Series from Personal Income and Outlays
Tags
Value Added
Nonfinancial
Gross
Corporate
Business
National Income and Product Accounts
Bureau of Economic Analysis
Gross Domestic Product
Quarterly
Seasonally Adjusted
Nation
Public Domain: Citation Requested
United States of America
Before Tax
Inventory Valuation Adjustment
Capital Consumption Adjustment
Corporate Profits
Tax
Finance Companies
Companies
Finance
Financial
Transactions
Sector
Domestic
Z.1 US Financial Accounts
Board of Governors
Secondary Market
Bills
3-Month
H.15 Selected Interest Rates
Treasury
Interest Rate
Interest
Rate
Monthly
Not Seasonally Adjusted
Chained
Headline Figure
Personal Consumption Expenditures
Consumption Expenditures
Consumption
Personal
Inflation
Price Index
Indexes
Price