Federal Reserve Economic Data

FRED Graph

1Y5Y10YMax
to
Date:
Line 1 - Consumer Price Index for All Urban Consumers: All Items in U.S. City Average, Feb 2020=100
Line 1
(a) Consumer Price Index for All Urban Consumers: All Items in U.S. City Average, Index 1982-1984=100, Seasonally Adjusted (CPIAUCSL)
The Consumer Price Index for All Urban Consumers: All Items (CPIAUCSL) is a price index of a basket of goods and services paid by urban consumers. Percent changes in the price index measure the inflation rate between any two time periods. The most common inflation metric is the percent change from one year ago. It can also represent the buying habits of urban consumers. This particular index includes roughly 88 percent of the total population, accounting for wage earners, clerical workers, technical workers, self-employed, short-term workers, unemployed, retirees, and those not in the labor force. The CPIs are based on prices for food, clothing, shelter, and fuels; transportation fares; service fees (e.g., water and sewer service); and sales taxes. Prices are collected monthly from about 4,000 housing units and approximately 26,000 retail establishments across 87 urban areas. To calculate the index, price changes are averaged with weights representing their importance in the spending of the particular group. The index measures price changes (as a percent change) from a predetermined reference date. In addition to the original unadjusted index distributed, the Bureau of Labor Statistics also releases a seasonally adjusted index. The unadjusted series reflects all factors that may influence a change in prices. However, it can be very useful to look at the seasonally adjusted CPI, which removes the effects of seasonal changes, such as weather, school year, production cycles, and holidays. The CPI can be used to recognize periods of inflation and deflation. Significant increases in the CPI within a short time frame might indicate a period of inflation, and significant decreases in CPI within a short time frame might indicate a period of deflation. However, because the CPI includes volatile food and oil prices, it might not be a reliable measure of inflationary and deflationary periods. For a more accurate detection, the core CPI (CPILFESL (https://fred.stlouisfed.org/series/CPILFESL)) is often used. When using the CPI, please note that it is not applicable to all consumers and should not be used to determine relative living costs. Additionally, the CPI is a statistical measure vulnerable to sampling error since it is based on a sample of prices and not the complete average. For more information on the consumer price indexes, see: Bureau of Economic Analysis. "CPI Detailed Report." (https://www.bls.gov/cpi/) 2013. Handbook of Methods (https://www.bls.gov/opub/hom/pdf/cpihom.pdf) Understanding the CPI: Frequently Asked Questions (https://www.bls.gov/cpi/questions-and-answers.htm)

Select a date that will equal 100 for your custom index:
  Enter date as YYYY-MM-DD
to

Write a custom formula to transform one or more series or combine two or more series.

You can begin by adding a series to combine with your existing series.

Type keywords to search for data

    Now create a custom formula to combine or transform the series.

    For example, invert an exchange rate by using formula 1/a, where “a” refers to the first FRED data series added to this line. Or calculate the spread between 2 interest rates, a and b, by using the formula a - b.

    Use the assigned data series variables (a, b, c, etc.) together with operators (+, -, *, /, ^, etc.), parentheses and constants (1, 1.5, 2, etc.) to create your own formula (e.g., 1/a, a-b, (a+b)/2, (a/(a+b+c))*100). As noted above, you may add other data series to this line before entering a formula.

    Finally, you can change the units of your new series.

    Select a date that will equal 100 for your custom index:
        Enter date as YYYY-MM-DD

    Line 1 - Consumer Price Index for All Urban Consumers: All Items in U.S. City Average, Feb 2020=100
    Line 2
    (a) Consumer Price Index for All Urban Consumers: Food and Beverages in U.S. City Average, Index 1982-1984=100, Seasonally Adjusted (CPIFABSL)

    Select a date that will equal 100 for your custom index:
      Enter date as YYYY-MM-DD
    to

    Write a custom formula to transform one or more series or combine two or more series.

    You can begin by adding a series to combine with your existing series.

    Type keywords to search for data

      Now create a custom formula to combine or transform the series.

      For example, invert an exchange rate by using formula 1/a, where “a” refers to the first FRED data series added to this line. Or calculate the spread between 2 interest rates, a and b, by using the formula a - b.

      Use the assigned data series variables (a, b, c, etc.) together with operators (+, -, *, /, ^, etc.), parentheses and constants (1, 1.5, 2, etc.) to create your own formula (e.g., 1/a, a-b, (a+b)/2, (a/(a+b+c))*100). As noted above, you may add other data series to this line before entering a formula.

      Finally, you can change the units of your new series.

      Select a date that will equal 100 for your custom index:
          Enter date as YYYY-MM-DD

      Line 1 - Consumer Price Index for All Urban Consumers: All Items in U.S. City Average, Feb 2020=100
      Line 3
      (a) Consumer Price Index for All Urban Consumers: Housing in U.S. City Average, Index 1982-1984=100, Not Seasonally Adjusted (CPIHOSNS)

      Select a date that will equal 100 for your custom index:
        Enter date as YYYY-MM-DD
      to

      Write a custom formula to transform one or more series or combine two or more series.

      You can begin by adding a series to combine with your existing series.

      Type keywords to search for data

        Now create a custom formula to combine or transform the series.

        For example, invert an exchange rate by using formula 1/a, where “a” refers to the first FRED data series added to this line. Or calculate the spread between 2 interest rates, a and b, by using the formula a - b.

        Use the assigned data series variables (a, b, c, etc.) together with operators (+, -, *, /, ^, etc.), parentheses and constants (1, 1.5, 2, etc.) to create your own formula (e.g., 1/a, a-b, (a+b)/2, (a/(a+b+c))*100). As noted above, you may add other data series to this line before entering a formula.

        Finally, you can change the units of your new series.

        Select a date that will equal 100 for your custom index:
            Enter date as YYYY-MM-DD

        Line 1 - Consumer Price Index for All Urban Consumers: All Items in U.S. City Average, Feb 2020=100
        Line 4
        (a) Consumer Price Index for All Urban Consumers: Transportation in U.S. City Average, Index 1982-1984=100, Seasonally Adjusted (CPITRNSL)

        Select a date that will equal 100 for your custom index:
          Enter date as YYYY-MM-DD
        to

        Write a custom formula to transform one or more series or combine two or more series.

        You can begin by adding a series to combine with your existing series.

        Type keywords to search for data

          Now create a custom formula to combine or transform the series.

          For example, invert an exchange rate by using formula 1/a, where “a” refers to the first FRED data series added to this line. Or calculate the spread between 2 interest rates, a and b, by using the formula a - b.

          Use the assigned data series variables (a, b, c, etc.) together with operators (+, -, *, /, ^, etc.), parentheses and constants (1, 1.5, 2, etc.) to create your own formula (e.g., 1/a, a-b, (a+b)/2, (a/(a+b+c))*100). As noted above, you may add other data series to this line before entering a formula.

          Finally, you can change the units of your new series.

          Select a date that will equal 100 for your custom index:
              Enter date as YYYY-MM-DD

          Line 1 - Consumer Price Index for All Urban Consumers: All Items in U.S. City Average, Feb 2020=100
          Line 5
          (a) Consumer Price Index for All Urban Consumers: Medical Care in U.S. City Average, Index 1982-1984=100, Seasonally Adjusted (CPIMEDSL)

          Select a date that will equal 100 for your custom index:
            Enter date as YYYY-MM-DD
          to

          Write a custom formula to transform one or more series or combine two or more series.

          You can begin by adding a series to combine with your existing series.

          Type keywords to search for data

            Now create a custom formula to combine or transform the series.

            For example, invert an exchange rate by using formula 1/a, where “a” refers to the first FRED data series added to this line. Or calculate the spread between 2 interest rates, a and b, by using the formula a - b.

            Use the assigned data series variables (a, b, c, etc.) together with operators (+, -, *, /, ^, etc.), parentheses and constants (1, 1.5, 2, etc.) to create your own formula (e.g., 1/a, a-b, (a+b)/2, (a/(a+b+c))*100). As noted above, you may add other data series to this line before entering a formula.

            Finally, you can change the units of your new series.

            Select a date that will equal 100 for your custom index:
                Enter date as YYYY-MM-DD

            Line 1 - Consumer Price Index for All Urban Consumers: All Items in U.S. City Average, Feb 2020=100
            Line 6
            (a) Consumer Price Index for All Urban Consumers: Apparel in U.S. City Average, Index 1982-1984=100, Seasonally Adjusted (CPIAPPSL)

            Select a date that will equal 100 for your custom index:
              Enter date as YYYY-MM-DD
            to

            Write a custom formula to transform one or more series or combine two or more series.

            You can begin by adding a series to combine with your existing series.

            Type keywords to search for data

              Now create a custom formula to combine or transform the series.

              For example, invert an exchange rate by using formula 1/a, where “a” refers to the first FRED data series added to this line. Or calculate the spread between 2 interest rates, a and b, by using the formula a - b.

              Use the assigned data series variables (a, b, c, etc.) together with operators (+, -, *, /, ^, etc.), parentheses and constants (1, 1.5, 2, etc.) to create your own formula (e.g., 1/a, a-b, (a+b)/2, (a/(a+b+c))*100). As noted above, you may add other data series to this line before entering a formula.

              Finally, you can change the units of your new series.

              Select a date that will equal 100 for your custom index:
                  Enter date as YYYY-MM-DD

              Line 1 - Consumer Price Index for All Urban Consumers: All Items in U.S. City Average, Feb 2020=100
              Line 7
              (a) Consumer Price Index for All Urban Consumers: Recreation in U.S. City Average, Index Dec 1997=100, Seasonally Adjusted (CPIRECSL)

              Select a date that will equal 100 for your custom index:
                Enter date as YYYY-MM-DD
              to

              Write a custom formula to transform one or more series or combine two or more series.

              You can begin by adding a series to combine with your existing series.

              Type keywords to search for data

                Now create a custom formula to combine or transform the series.

                For example, invert an exchange rate by using formula 1/a, where “a” refers to the first FRED data series added to this line. Or calculate the spread between 2 interest rates, a and b, by using the formula a - b.

                Use the assigned data series variables (a, b, c, etc.) together with operators (+, -, *, /, ^, etc.), parentheses and constants (1, 1.5, 2, etc.) to create your own formula (e.g., 1/a, a-b, (a+b)/2, (a/(a+b+c))*100). As noted above, you may add other data series to this line before entering a formula.

                Finally, you can change the units of your new series.

                Select a date that will equal 100 for your custom index:
                    Enter date as YYYY-MM-DD

                Line 1 - Consumer Price Index for All Urban Consumers: All Items in U.S. City Average, Feb 2020=100
                Line 8
                (a) Consumer Price Index for All Urban Consumers: Other Goods and Services in U.S. City Average, Index 1982-1984=100, Seasonally Adjusted (CPIOGSSL)

                Select a date that will equal 100 for your custom index:
                  Enter date as YYYY-MM-DD
                to

                Write a custom formula to transform one or more series or combine two or more series.

                You can begin by adding a series to combine with your existing series.

                Type keywords to search for data

                  Now create a custom formula to combine or transform the series.

                  For example, invert an exchange rate by using formula 1/a, where “a” refers to the first FRED data series added to this line. Or calculate the spread between 2 interest rates, a and b, by using the formula a - b.

                  Use the assigned data series variables (a, b, c, etc.) together with operators (+, -, *, /, ^, etc.), parentheses and constants (1, 1.5, 2, etc.) to create your own formula (e.g., 1/a, a-b, (a+b)/2, (a/(a+b+c))*100). As noted above, you may add other data series to this line before entering a formula.

                  Finally, you can change the units of your new series.

                  Select a date that will equal 100 for your custom index:
                      Enter date as YYYY-MM-DD

                  Line 1 - Consumer Price Index for All Urban Consumers: All Items in U.S. City Average, Feb 2020=100
                  Line 9
                  (a) Consumer Price Index for All Urban Consumers: Education and Communication in U.S. City Average, Index Dec 1997=100, Seasonally Adjusted (CPIEDUSL)

                  Select a date that will equal 100 for your custom index:
                    Enter date as YYYY-MM-DD
                  to

                  Write a custom formula to transform one or more series or combine two or more series.

                  You can begin by adding a series to combine with your existing series.

                  Type keywords to search for data

                    Now create a custom formula to combine or transform the series.

                    For example, invert an exchange rate by using formula 1/a, where “a” refers to the first FRED data series added to this line. Or calculate the spread between 2 interest rates, a and b, by using the formula a - b.

                    Use the assigned data series variables (a, b, c, etc.) together with operators (+, -, *, /, ^, etc.), parentheses and constants (1, 1.5, 2, etc.) to create your own formula (e.g., 1/a, a-b, (a+b)/2, (a/(a+b+c))*100). As noted above, you may add other data series to this line before entering a formula.

                    Finally, you can change the units of your new series.

                    Select a date that will equal 100 for your custom index:
                        Enter date as YYYY-MM-DD

                    ADDLINE
                    Type keywords to search for data
                    Create user-defined line
                    You can customize a graph by adding a straight line between two data points.
                    FORMAT GRAPH
                    Details
                    Display
                    Customize
                    Frame
                    Plot area
                    Text

                    Line 1
                    Consumer Price Index for All Urban Consumers: All Items in U.S. City Average, Feb 2020=100
                    Line details & color

                    Line style, thickness, color and position


                    Line 2
                    Consumer Price Index for All Urban Consumers: Food and Beverages in U.S. City Average, Feb 2020=100
                    Line details & color

                    Line style, thickness, color and position


                    Line 3
                    Consumer Price Index for All Urban Consumers: Housing in U.S. City Average, Feb 2020=100
                    Line details & color

                    Line style, thickness, color and position


                    Line 4
                    Consumer Price Index for All Urban Consumers: Transportation in U.S. City Average, Feb 2020=100
                    Line details & color

                    Line style, thickness, color and position


                    Line 5
                    Consumer Price Index for All Urban Consumers: Medical Care in U.S. City Average, Feb 2020=100
                    Line details & color

                    Line style, thickness, color and position


                    Line 6
                    Consumer Price Index for All Urban Consumers: Apparel in U.S. City Average, Feb 2020=100
                    Line details & color

                    Line style, thickness, color and position


                    Line 7
                    Consumer Price Index for All Urban Consumers: Recreation in U.S. City Average, Feb 2020=100
                    Line details & color

                    Line style, thickness, color and position


                    Line 8
                    Consumer Price Index for All Urban Consumers: Other Goods and Services in U.S. City Average, Feb 2020=100
                    Line details & color

                    Line style, thickness, color and position


                    Line 9
                    Consumer Price Index for All Urban Consumers: Education and Communication in U.S. City Average, Feb 2020=100
                    Line details & color

                    Line style, thickness, color and position


                    Fullscreen

                    Notes

                    Source: U.S. Bureau of Labor Statistics  

                    Release: Consumer Price Index  

                    Units:  Index 1982-1984=100, Seasonally Adjusted

                    Frequency:  Monthly

                    Notes:

                    The Consumer Price Index for All Urban Consumers: All Items (CPIAUCSL) is a price index of a basket of goods and services paid by urban consumers. Percent changes in the price index measure the inflation rate between any two time periods. The most common inflation metric is the percent change from one year ago. It can also represent the buying habits of urban consumers. This particular index includes roughly 88 percent of the total population, accounting for wage earners, clerical workers, technical workers, self-employed, short-term workers, unemployed, retirees, and those not in the labor force.

                    The CPIs are based on prices for food, clothing, shelter, and fuels; transportation fares; service fees (e.g., water and sewer service); and sales taxes. Prices are collected monthly from about 4,000 housing units and approximately 26,000 retail establishments across 87 urban areas. To calculate the index, price changes are averaged with weights representing their importance in the spending of the particular group. The index measures price changes (as a percent change) from a predetermined reference date. In addition to the original unadjusted index distributed, the Bureau of Labor Statistics also releases a seasonally adjusted index. The unadjusted series reflects all factors that may influence a change in prices. However, it can be very useful to look at the seasonally adjusted CPI, which removes the effects of seasonal changes, such as weather, school year, production cycles, and holidays.

                    The CPI can be used to recognize periods of inflation and deflation. Significant increases in the CPI within a short time frame might indicate a period of inflation, and significant decreases in CPI within a short time frame might indicate a period of deflation. However, because the CPI includes volatile food and oil prices, it might not be a reliable measure of inflationary and deflationary periods. For a more accurate detection, the core CPI (CPILFESL) is often used. When using the CPI, please note that it is not applicable to all consumers and should not be used to determine relative living costs. Additionally, the CPI is a statistical measure vulnerable to sampling error since it is based on a sample of prices and not the complete average.

                    For more information on the consumer price indexes, see:
                    Bureau of Economic Analysis. "CPI Detailed Report." 2013.
                    Handbook of Methods
                    Understanding the CPI: Frequently Asked Questions

                    Suggested Citation:

                    U.S. Bureau of Labor Statistics, Consumer Price Index for All Urban Consumers: All Items in U.S. City Average [CPIAUCSL], retrieved from FRED, Federal Reserve Bank of St. Louis; https://fred.stlouisfed.org/series/CPIAUCSL, April 9, 2025.

                    Source: U.S. Bureau of Labor Statistics  

                    Release: Consumer Price Index  

                    Units:  Index 1982-1984=100, Seasonally Adjusted

                    Frequency:  Monthly

                    Suggested Citation:

                    U.S. Bureau of Labor Statistics, Consumer Price Index for All Urban Consumers: Food and Beverages in U.S. City Average [CPIFABSL], retrieved from FRED, Federal Reserve Bank of St. Louis; https://fred.stlouisfed.org/series/CPIFABSL, April 9, 2025.

                    Source: U.S. Bureau of Labor Statistics  

                    Release: Consumer Price Index  

                    Units:  Index 1982-1984=100, Not Seasonally Adjusted

                    Frequency:  Monthly

                    Suggested Citation:

                    U.S. Bureau of Labor Statistics, Consumer Price Index for All Urban Consumers: Housing in U.S. City Average [CPIHOSNS], retrieved from FRED, Federal Reserve Bank of St. Louis; https://fred.stlouisfed.org/series/CPIHOSNS, April 9, 2025.

                    Source: U.S. Bureau of Labor Statistics  

                    Release: Consumer Price Index  

                    Units:  Index 1982-1984=100, Seasonally Adjusted

                    Frequency:  Monthly

                    Suggested Citation:

                    U.S. Bureau of Labor Statistics, Consumer Price Index for All Urban Consumers: Transportation in U.S. City Average [CPITRNSL], retrieved from FRED, Federal Reserve Bank of St. Louis; https://fred.stlouisfed.org/series/CPITRNSL, April 9, 2025.

                    Source: U.S. Bureau of Labor Statistics  

                    Release: Consumer Price Index  

                    Units:  Index 1982-1984=100, Seasonally Adjusted

                    Frequency:  Monthly

                    Suggested Citation:

                    U.S. Bureau of Labor Statistics, Consumer Price Index for All Urban Consumers: Medical Care in U.S. City Average [CPIMEDSL], retrieved from FRED, Federal Reserve Bank of St. Louis; https://fred.stlouisfed.org/series/CPIMEDSL, April 9, 2025.

                    Source: U.S. Bureau of Labor Statistics  

                    Release: Consumer Price Index  

                    Units:  Index 1982-1984=100, Seasonally Adjusted

                    Frequency:  Monthly

                    Suggested Citation:

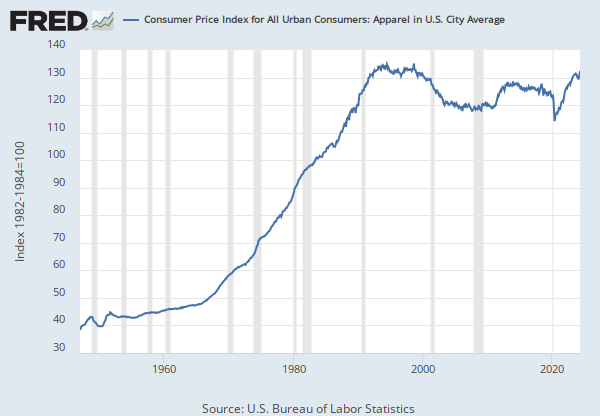
                    U.S. Bureau of Labor Statistics, Consumer Price Index for All Urban Consumers: Apparel in U.S. City Average [CPIAPPSL], retrieved from FRED, Federal Reserve Bank of St. Louis; https://fred.stlouisfed.org/series/CPIAPPSL, April 9, 2025.

                    Source: U.S. Bureau of Labor Statistics  

                    Release: Consumer Price Index  

                    Units:  Index Dec 1997=100, Seasonally Adjusted

                    Frequency:  Monthly

                    Suggested Citation:

                    U.S. Bureau of Labor Statistics, Consumer Price Index for All Urban Consumers: Recreation in U.S. City Average [CPIRECSL], retrieved from FRED, Federal Reserve Bank of St. Louis; https://fred.stlouisfed.org/series/CPIRECSL, April 9, 2025.

                    Source: U.S. Bureau of Labor Statistics  

                    Release: Consumer Price Index  

                    Units:  Index 1982-1984=100, Seasonally Adjusted

                    Frequency:  Monthly

                    Suggested Citation:

                    U.S. Bureau of Labor Statistics, Consumer Price Index for All Urban Consumers: Other Goods and Services in U.S. City Average [CPIOGSSL], retrieved from FRED, Federal Reserve Bank of St. Louis; https://fred.stlouisfed.org/series/CPIOGSSL, April 9, 2025.

                    Source: U.S. Bureau of Labor Statistics  

                    Release: Consumer Price Index  

                    Units:  Index Dec 1997=100, Seasonally Adjusted

                    Frequency:  Monthly

                    Suggested Citation:

                    U.S. Bureau of Labor Statistics, Consumer Price Index for All Urban Consumers: Education and Communication in U.S. City Average [CPIEDUSL], retrieved from FRED, Federal Reserve Bank of St. Louis; https://fred.stlouisfed.org/series/CPIEDUSL, April 9, 2025.

                    Related Data and Content

                    Data Suggestions Based On Your Search

                    Content Suggestions

                    Other Formats

                    Consumer Price Index for All Urban Consumers: All Items in U.S. City Average

                    Monthly, Not Seasonally Adjusted Semiannual, Not Seasonally Adjusted

                    Consumer Price Index for All Urban Consumers: Food and Beverages in U.S. City Average

                    Monthly, Not Seasonally Adjusted Semiannual, Not Seasonally Adjusted

                    Consumer Price Index for All Urban Consumers: Housing in U.S. City Average

                    Monthly, Seasonally Adjusted Semiannual, Not Seasonally Adjusted

                    Consumer Price Index for All Urban Consumers: Transportation in U.S. City Average

                    Monthly, Not Seasonally Adjusted Semiannual, Not Seasonally Adjusted

                    Consumer Price Index for All Urban Consumers: Medical Care in U.S. City Average

                    Monthly, Not Seasonally Adjusted Semiannual, Not Seasonally Adjusted

                    Consumer Price Index for All Urban Consumers: Apparel in U.S. City Average

                    Monthly, Not Seasonally Adjusted Semiannual, Not Seasonally Adjusted

                    Consumer Price Index for All Urban Consumers: Recreation in U.S. City Average

                    Monthly, Not Seasonally Adjusted Semiannual, Not Seasonally Adjusted

                    Consumer Price Index for All Urban Consumers: Other Goods and Services in U.S. City Average

                    Monthly, Not Seasonally Adjusted Semiannual, Not Seasonally Adjusted

                    Consumer Price Index for All Urban Consumers: Education and Communication in U.S. City Average

                    Monthly, Not Seasonally Adjusted Semiannual, Not Seasonally Adjusted

                    Related Categories

                    Releases

                    Tags


                    Subscribe to the FRED newsletter


                    Follow us

                    Back to Top
                    Color format