Notes
Source: U.S. Census Bureau
Release: Monthly Retail Trade and Food Services
Units:
Frequency:
Notes:
Information about the Monthly Retail Trade Survey can be found on the Census website at https://www.census.gov/retail/mrts/about_the_surveys.html
Suggested Citation:
U.S. Census Bureau, Retail Sales: Retail Trade, Excluding Motor Vehicle and Parts Dealers [MRTSSM4400AUSS], retrieved from FRED, Federal Reserve Bank of St. Louis; https://fred.stlouisfed.org/series/MRTSSM4400AUSS, .
Source: U.S. Bureau of Labor Statistics
Release: Consumer Price Index
Units:
Frequency:
Notes:
The Consumer Price Index for All Urban Consumers: All Items (CPIAUCSL) is a price index of a basket of goods and services paid by urban consumers. Percent changes in the price index measure the inflation rate between any two time periods. The most common inflation metric is the percent change from one year ago. It can also represent the buying habits of urban consumers. This particular index includes roughly 88 percent of the total population, accounting for wage earners, clerical workers, technical workers, self-employed, short-term workers, unemployed, retirees, and those not in the labor force.
The CPIs are based on prices for food, clothing, shelter, and fuels; transportation fares; service fees (e.g., water and sewer service); and sales taxes. Prices are collected monthly from about 4,000 housing units and approximately 26,000 retail establishments across 87 urban areas. To calculate the index, price changes are averaged with weights representing their importance in the spending of the particular group. The index measures price changes (as a percent change) from a predetermined reference date. In addition to the original unadjusted index distributed, the Bureau of Labor Statistics also releases a seasonally adjusted index. The unadjusted series reflects all factors that may influence a change in prices. However, it can be very useful to look at the seasonally adjusted CPI, which removes the effects of seasonal changes, such as weather, school year, production cycles, and holidays.
The CPI can be used to recognize periods of inflation and deflation. Significant increases in the CPI within a short time frame might indicate a period of inflation, and significant decreases in CPI within a short time frame might indicate a period of deflation. However, because the CPI includes volatile food and oil prices, it might not be a reliable measure of inflationary and deflationary periods. For a more accurate detection, the core CPI (CPILFESL) is often used. When using the CPI, please note that it is not applicable to all consumers and should not be used to determine relative living costs. Additionally, the CPI is a statistical measure vulnerable to sampling error since it is based on a sample of prices and not the complete average.
For more information on the CPI, see the Handbook of Methods, the release notes and announcements, and the Frequently Asked Questions (FAQs).
Suggested Citation:
U.S. Bureau of Labor Statistics, Consumer Price Index for All Urban Consumers: All Items in U.S. City Average [CPIAUCSL], retrieved from FRED, Federal Reserve Bank of St. Louis; https://fred.stlouisfed.org/series/CPIAUCSL, .
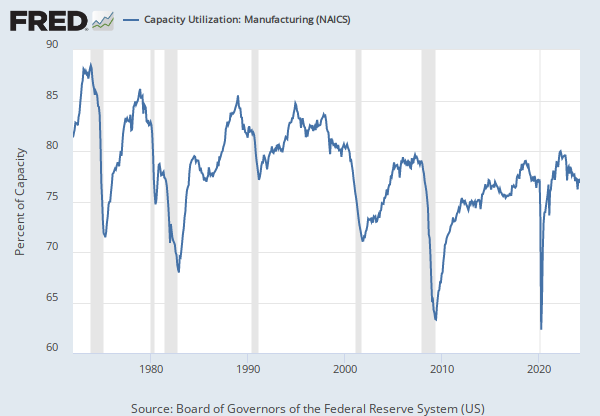
Source: Board of Governors of the Federal Reserve System (US)
Release: G.17 Industrial Production and Capacity Utilization
Units:
Frequency:
Notes:
The Federal Reserve's monthly index of industrial production and the related capacity indexes and capacity utilization rates cover manufacturing, mining, and electric and gas utilities. The industrial sector, together with construction, accounts for the bulk of the variation in national output over the course of the business cycle. The industrial detail provided by these measures helps illuminate structural developments in the economy. The industrial production (IP) index measures the real output of all relevant establishments located in the United States, regardless of their ownership, but not those located in U.S. territories. For more information, see the explanatory notes issued by the Board of Governors. For recent updates, see the announcements issued by the Board of Governors.
Suggested Citation:
Board of Governors of the Federal Reserve System (US), Industrial Production: Manufacturing (NAICS) [IPMAN], retrieved from FRED, Federal Reserve Bank of St. Louis; https://fred.stlouisfed.org/series/IPMAN, .
Source: U.S. Census Bureau
Release: Advance Monthly Sales for Retail and Food Services
Units:
Frequency:
Notes:
E-commerce sales are included in the total monthly sales estimates.
The value for the most recent month is an advance estimate that is based on data from a subsample of firms from the larger Monthly Retail Trade Survey. The advance estimate will be superseded in following months by revised estimates derived from the larger Monthly Retail Trade Survey. The associated series from the Monthly Retail Trade Survey is available at https://fred.stlouisfed.org/series/MRTSSM44000USS
Information about the Advance Monthly Retail Sales Survey can be found on the Census website at https://www.census.gov/retail/marts/about_the_surveys.html
Suggested Citation:
U.S. Census Bureau, Advance Retail Sales: Retail Trade [RSXFS], retrieved from FRED, Federal Reserve Bank of St. Louis; https://fred.stlouisfed.org/series/RSXFS, .
Release Tables
Advance Monthly Sales for Retail and Food Services
Consumer Price Index
G.17 Industrial Production and Capacity Utilization
Monthly Retail Trade and Food Services
Related Data and Content
Data Suggestions Based On Your Search


Content Suggestions


Other Formats
Retail Sales: Retail Trade, Excluding Motor Vehicle and Parts Dealers
Monthly, Not Seasonally Adjusted Percent Change from Preceding Period, Monthly, Not Seasonally Adjusted Percent Change from Preceding Period, Monthly, Seasonally AdjustedConsumer Price Index for All Urban Consumers: All Items in U.S. City Average
Monthly, Not Seasonally Adjusted Semiannual, Not Seasonally AdjustedIndustrial Production: Manufacturing (NAICS)
Annual, Not Seasonally Adjusted Monthly, Not Seasonally Adjusted Quarterly, Not Seasonally Adjusted Quarterly, Seasonally AdjustedAdvance Retail Sales: Retail Trade
Monthly, Not Seasonally Adjusted Percent Change from Preceding Period, Monthly, Not Seasonally Adjusted Percent Change from Preceding Period, Monthly, Seasonally AdjustedRelated Categories
Retail Trade
Production & Business Activity
Consumer Price Indexes (CPI and PCE)
Prices
Industrial Production & Capacity Utilization
Releases
More
Series from Monthly Retail Trade and Food Services
More
Series from Consumer Price Index
More
Series from G.17 Industrial Production and Capacity Utilization
More
Series from Advance Monthly Sales for Retail and Food Services
Tags
Trade
Vehicles
Retail Trade
Sales
Retail
Census
Seasonally Adjusted
Monthly
Nation
Public Domain: Citation Requested
United States of America
Headline Figure
Average
All Items
Urban
Consumer
Consumer Price Index
Inflation
Price Index
Indexes
Price
Bureau of Labor Statistics
G.17 Industr. Production & Capacity Utilization
North American Industry Classification System
Industrial Production
Production
Manufacturing
Industry
Board of Governors
Services