Notes
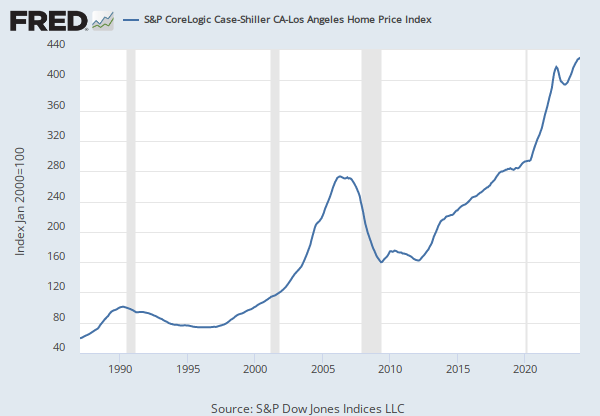
Source: S&P Dow Jones Indices LLC
Release: S&P Cotality Case-Shiller Home Price Indices
Units:
Frequency:
Notes:
For more information regarding the index, please visit Standard & Poor's. There is more information about home price sales pairs in the Methodology section. Copyright, 2016, Standard & Poor's Financial Services LLC. Reprinted with permission.
Suggested Citation:
S&P Dow Jones Indices LLC, S&P CoreLogic Case-Shiller U.S. National Home Price Index (DISCONTINUED) [USCSCOMHPISA], retrieved from FRED, Federal Reserve Bank of St. Louis; https://fred.stlouisfed.org/series/USCSCOMHPISA, .
Source: U.S. Bureau of Economic Analysis
Release: Gross Domestic Product
Units:
Frequency:
Notes:
BEA Account Code: A191RD
The number of decimal places reported varies over time. A Guide to the National Income and Product Accounts of the United States (NIPA).
Suggested Citation:
U.S. Bureau of Economic Analysis, Gross Domestic Product: Implicit Price Deflator [GDPDEF], retrieved from FRED, Federal Reserve Bank of St. Louis; https://fred.stlouisfed.org/series/GDPDEF, .
Release Tables
Gross Domestic Product
Related Data and Content
Data Suggestions Based On Your Search


Content Suggestions


Other Formats
S&P CoreLogic Case-Shiller U.S. National Home Price Index (DISCONTINUED)
Quarterly, Not Seasonally AdjustedGross Domestic Product: Implicit Price Deflator
Percent Change from Preceding Period, Annual, Not Seasonally Adjusted Percent Change from Preceding Period, Quarterly, Seasonally Adjusted Annual RateRelated Categories
House Price Indexes
Prices
Price Indexes & Deflators
National Income & Product Accounts
National Accounts
Releases
More
Series from S&P Cotality Case-Shiller Home Price Indices
More
Series from Gross Domestic Product
Tags
Composite
S&P Cotality Case-Shiller Home Price Indices
S&P Dow Jones Indices LLC
Copyrighted: Pre-Approval Required
House Price Index
Housing
Discontinued
Price Index
Quarterly
Indexes
Price
Seasonally Adjusted
Nation
United States of America
Implicit Price Deflator
Headline Figure
National Income and Product Accounts
Inflation
Bureau of Economic Analysis
Gross Domestic Product
Public Domain: Citation Requested