Notes
Source: Federal Reserve Bank of St. Louis
Release: Interest Rate Spreads
Units:
Frequency:
Notes:
Starting with the update on June 21, 2019, the Treasury bond data used in calculating interest rate spreads is obtained directly from the U.S. Treasury Department.
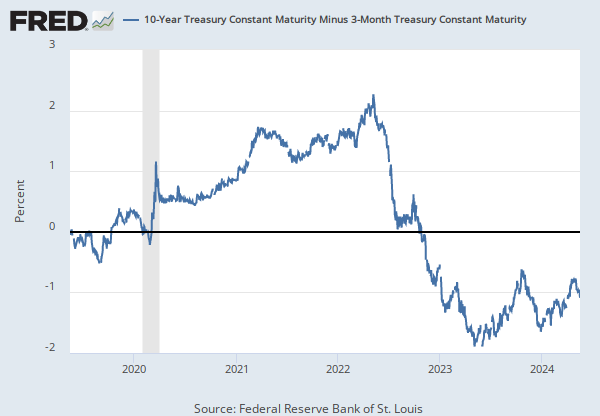
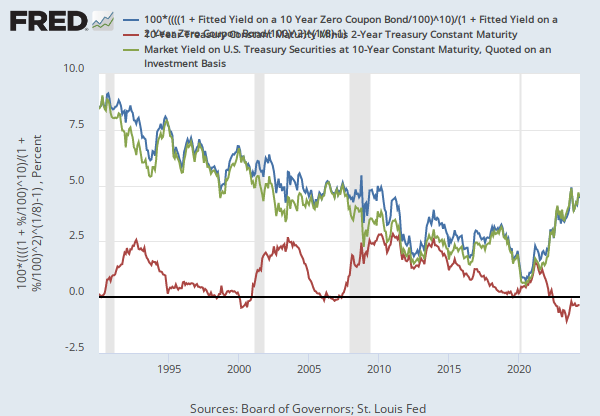
Series is calculated as the spread between 10-Year Treasury Constant Maturity (BC_10YEAR) and 2-Year Treasury Constant Maturity (BC_2YEAR). Both underlying series are published at the U.S. Treasury Department.
Suggested Citation:
Federal Reserve Bank of St. Louis, 10-Year Treasury Constant Maturity Minus 2-Year Treasury Constant Maturity [T10Y2Y], retrieved from FRED, Federal Reserve Bank of St. Louis; https://fred.stlouisfed.org/series/T10Y2Y, .
Source: S&P Dow Jones Indices LLC
Release: S&P Cotality Case-Shiller Home Price Indices
Units:
Frequency:
Notes:
For more information regarding the index, please visit Standard & Poor's. There is more information about home price sales pairs in the Methodology section. Copyright, 2016, Standard & Poor's Financial Services LLC. Reprinted with permission.
Suggested Citation:
S&P Dow Jones Indices LLC, S&P Cotality Case-Shiller U.S. National Home Price Index [CSUSHPISA], retrieved from FRED, Federal Reserve Bank of St. Louis; https://fred.stlouisfed.org/series/CSUSHPISA, .
Release Tables
S&P Cotality Case-Shiller Home Price Indices
Related Data and Content
Data Suggestions Based On Your Search


Content Suggestions


Other Formats
10-Year Treasury Constant Maturity Minus 2-Year Treasury Constant Maturity
Monthly, Not Seasonally AdjustedS&P Cotality Case-Shiller U.S. National Home Price Index
Monthly, Not Seasonally AdjustedRelated Categories
Releases
More
Series from Interest Rate Spreads
More
Series from S&P Cotality Case-Shiller Home Price Indices
Tags
2-Year
Yield Curve
Spread
10-Year
Maturity
Treasury
Interest Rate
Interest
Daily
St. Louis Fed
Rate
Copyrighted: Citation Required
Nation
United States of America
Not Seasonally Adjusted
S&P Cotality Case-Shiller Home Price Indices
S&P Dow Jones Indices LLC
House Price Index
Copyrighted: Pre-Approval Required
Housing
Price Index
Indexes
Price
Seasonally Adjusted
Monthly