Notes
Source: Federal Reserve Bank of St. Louis
Release: Interest Rate Spreads
Units:
Frequency:
Notes:
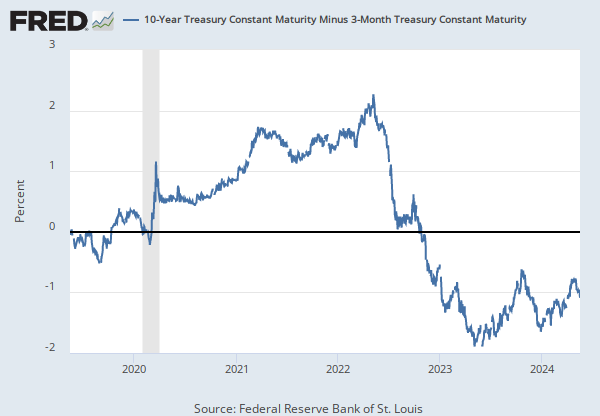
Series is calculated as the spread between 10-Year Treasury Constant Maturity (BC_10YEAR) and 3-Month Treasury Constant Maturity (BC_3MONTH).
Starting with the update on June 21, 2019, the Treasury bond data used in calculating interest rate spreads is obtained directly from the U.S. Treasury Department.
Suggested Citation:
Federal Reserve Bank of St. Louis, 10-Year Treasury Constant Maturity Minus 3-Month Treasury Constant Maturity [T10Y3M], retrieved from FRED, Federal Reserve Bank of St. Louis; https://fred.stlouisfed.org/series/T10Y3M, .
Source: Federal Reserve Bank of St. Louis
Release: Interest Rate Spreads
Units:
Frequency:
Notes:
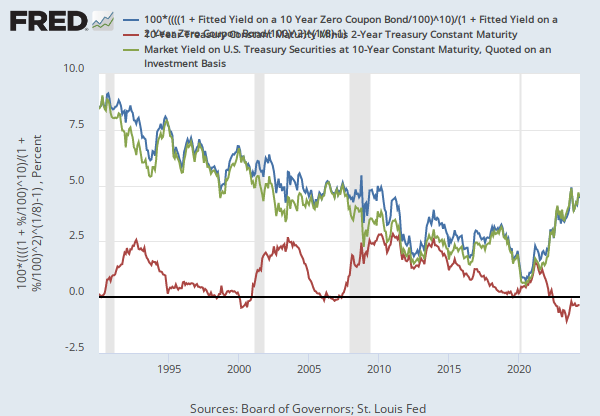
Starting with the update on June 21, 2019, the Treasury bond data used in calculating interest rate spreads is obtained directly from the U.S. Treasury Department.
Series is calculated as the spread between 10-Year Treasury Constant Maturity (BC_10YEAR) and 2-Year Treasury Constant Maturity (BC_2YEAR). Both underlying series are published at the U.S. Treasury Department.
Suggested Citation:
Federal Reserve Bank of St. Louis, 10-Year Treasury Constant Maturity Minus 2-Year Treasury Constant Maturity [T10Y2Y], retrieved from FRED, Federal Reserve Bank of St. Louis; https://fred.stlouisfed.org/series/T10Y2Y, .
Source: Federal Reserve Bank of Chicago
Release: Chicago Fed National Financial Conditions Index
Units:
Frequency:
Notes:
The Chicago Fed’s National Financial Conditions Index (NFCI) provides a comprehensive weekly update on U.S. financial conditions in money markets, debt and equity markets and the traditional and “shadow” banking systems. Source: http://www.chicagofed.org/webpages/publications/nfci/index.cfm.
"Positive values of the NFCI indicate financial conditions that are tighter than average, while negative values indicate financial conditions that are looser than average."
"The three subindexes of the NFCI (risk, credit and leverage) allow for a more detailed examination of the movements in the NFCI. Like the NFCI, each is constructed to have an average value of zero and a standard deviation of one over a sample period extending back to 1971. The risk subindex captures volatility and funding risk in the financial sector; the credit subindex is composed of measures of credit conditions; and the leverage subindex consists of debt and equity measures. Increasing risk, tighter credit conditions and declining leverage are consistent with tightening financial conditions. Thus, a positive value for an individual subindex indicates that the corresponding aspect of financial conditions is tighter than on average, while negative values indicate the opposite." Source: http://www.chicagofed.org/webpages/research/data/nfci/background.cfm.
For further information, please visit the Federal Reserve Bank of Chicago's NFCI website at http://www.chicagofed.org/webpages/publications/nfci/index.cfm.
Suggested Citation:
Federal Reserve Bank of Chicago, Chicago Fed National Financial Conditions Credit Subindex [NFCICREDIT], retrieved from FRED, Federal Reserve Bank of St. Louis; https://fred.stlouisfed.org/series/NFCICREDIT, .
Related Data and Content
Data Suggestions Based On Your Search


Content Suggestions


Other Formats
10-Year Treasury Constant Maturity Minus 3-Month Treasury Constant Maturity
Monthly, Not Seasonally Adjusted10-Year Treasury Constant Maturity Minus 2-Year Treasury Constant Maturity
Monthly, Not Seasonally AdjustedRelated Categories
Interest Rate Spreads
Interest Rates
Money, Banking, & Finance
Financial Activity Measures
Financial Indicators
Releases
More
Series from Interest Rate Spreads
More
Series from Chicago Fed National Financial Conditions Index