Notes
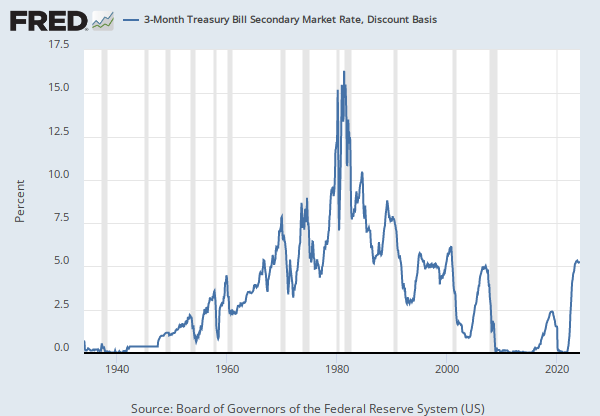
Source: Board of Governors of the Federal Reserve System (US)
Release: H.15 Selected Interest Rates
Units:
Frequency:
Notes:
Averages of daily figures.
For additional historical federal funds rate data, please see Daily Federal Funds Rate from 1928-1954.
The federal funds rate is the interest rate at which depository institutions trade federal funds (balances held at Federal Reserve Banks) with each other overnight. When a depository institution has surplus balances in its reserve account, it lends to other banks in need of larger balances. In simpler terms, a bank with excess cash, which is often referred to as liquidity, will lend to another bank that needs to quickly raise liquidity. (1) The rate that the borrowing institution pays to the lending institution is determined between the two banks; the weighted average rate for all of these types of negotiations is called the effective federal funds rate.(2) The effective federal funds rate is essentially determined by the market but is influenced by the Federal Reserve as it uses the Interest on Reserve Balances rate to steer the federal funds rate toward the target range.(2)
The Federal Open Market Committee (FOMC) meets eight times a year to determine the federal funds target range. The Fed's primary tool for influencing the federal funds rate is the interest the Fed pays on the funds that banks hold as reserve balances at their Federal Reserve Bank, which is the Interest on Reserves Balances (IORB) rate. Because banks are unlikely to lend funds in the federal funds market for less than they get paid in their reserve balance account at the Federal Reserve, the Interest on Reserve Balances (IORB) is an effective tool for guiding the federal funds rate. (3) Whether the Federal Reserve raises or lowers the target range for the federal funds rate depends on the state of the economy. If the FOMC believes the economy is growing too fast and inflation pressures are inconsistent with the dual mandate of the Federal Reserve, the Committee may temper economic activity by raising the target range for federal funds rate, and increasing the IORB rate to steer the federal funds rate into the target range. In the opposing scenario, the FOMC may spur greater economic activity by lowering the target range for federal funds rate, and decreasing the IORB rate to steer the federal funds rate into the target range. (3) Therefore, the FOMC must observe the current state of the economy to determine the best course of monetary policy that will maximize economic growth while adhering to the dual mandate set forth by Congress. In making its monetary policy decisions, the FOMC considers a wealth of economic data, such as: trends in prices and wages, employment, consumer spending and income, business investments, and foreign exchange markets.
The federal funds rate is the central interest rate in the U.S. financial market. It influences other interest rates such as the prime rate, which is the rate banks charge their customers with higher credit ratings. Additionally, the federal funds rate indirectly influences longer- term interest rates such as mortgages, loans, and savings, all of which are very important to consumer wealth and confidence.(2)
References
(1) Federal Reserve Bank of New York. "Federal funds." Fedpoints, August 2007.
(2) Monetary Policy, Board of Governors of the Federal Reserve System.
(3) The Fed Explained, Board of Governors of the Federal Reserve System
For further information, see The Fed's New Monetary Policy Tools, Page One Economics, Federal Reserve Bank of St. Louis.
For questions on the data, please contact the data source. For questions on FRED functionality, please contact us here.
Suggested Citation:
Board of Governors of the Federal Reserve System (US), Federal Funds Effective Rate [FEDFUNDS], retrieved from FRED, Federal Reserve Bank of St. Louis; https://fred.stlouisfed.org/series/FEDFUNDS, .
Source: U.S. Bureau of Economic Analysis
Release: Gross Domestic Product
Units:
Frequency:
Notes:
BEA Account Code: A551RC
A Guide to the National Income and Product Accounts of the United States (NIPA) - (http://www.bea.gov/national/pdf/nipaguid.pdf)
Suggested Citation:
U.S. Bureau of Economic Analysis, Corporate Profits After Tax with Inventory Valuation Adjustment (IVA) and Capital Consumption Adjustment (CCAdj) [CPATAX], retrieved from FRED, Federal Reserve Bank of St. Louis; https://fred.stlouisfed.org/series/CPATAX, .
Source: Organization for Economic Co-operation and Development
Release: Main Economic Indicators
Units:
Frequency:
Notes:
OECD Data Filters:
REF_AREA: USA
MEASURE: SHARE
UNIT_MEASURE: IX
ACTIVITY: _Z
ADJUSTMENT: _Z
TRANSFORMATION: _Z
TIME_HORIZ: _Z
METHODOLOGY: N
FREQ: M
All OECD data should be cited as follows: OECD (year), (dataset name), (data source) DOI or https://data-explorer.oecd.org/. (accessed on (date)).
Suggested Citation:
Organization for Economic Co-operation and Development, Financial Market: Share Prices for United States [SPASTT01USM661N], retrieved from FRED, Federal Reserve Bank of St. Louis; https://fred.stlouisfed.org/series/SPASTT01USM661N, .
Source: World Bank
Release: Global Financial Development
Units:
Frequency:
Notes:
Total value of all listed shares in a stock market as a percentage of GDP.
Value of listed shares to GDP, calculated using the following deflation method: {(0.5)*[Ft/P_et + Ft-1/P_et-1]}/[GDPt/P_at] where F is stock market capitalization, P_e is end-of period CPI, and P_a is average annual CPI. End-of period CPI (IFS line 64M..ZF or, if not available, 64Q..ZF) and annual CPI (IFS line 64..ZF) are from the IMF's International Financial Statistics. Standard & Poor's, Global Stock Markets Factbook and supplemental S&P data)
Source Code: GFDD.DM.01
Suggested Citation:
World Bank, Stock Market Capitalization to GDP for United States [DDDM01USA156NWDB], retrieved from FRED, Federal Reserve Bank of St. Louis; https://fred.stlouisfed.org/series/DDDM01USA156NWDB, .
Source: U.S. Bureau of Economic Analysis
Release: Gross Domestic Product
Units:
Frequency:
Notes:
BEA Account Code: A191RC
Gross domestic product (GDP), the featured measure of U.S. output, is the market value of the goods and services produced by labor and property located in the United States.For more information, see the Guide to the National Income and Product Accounts of the United States (NIPA) and the Bureau of Economic Analysis.
Suggested Citation:
U.S. Bureau of Economic Analysis, Gross Domestic Product [GDP], retrieved from FRED, Federal Reserve Bank of St. Louis; https://fred.stlouisfed.org/series/GDP, .
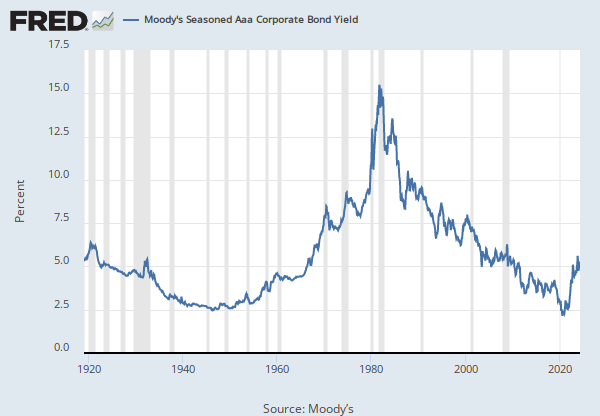
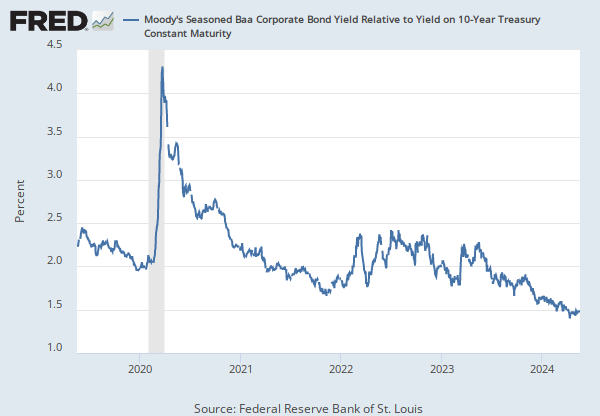
Source: Moody’s
Release: Moody's Daily Corporate Bond Yield Averages
Units:
Frequency:
Notes:
These instruments are based on bonds with maturities 20 years and above.
© 2017, Moody’s Corporation, Moody’s Investors Service, Inc., Moody’s Analytics, Inc. and/or their licensors and affiliates (collectively, “Moody’s”). All rights reserved. Moody’s ratings and other information (“Moody’s Information”) are proprietary to Moody’s and/or its licensors and are protected by copyright and other intellectual property laws. Moody’s Information is licensed to Client by Moody’s. MOODY’S INFORMATION MAY NOT BE COPIED OR OTHERWISE REPRODUCED, REPACKAGED, FURTHER TRANSMITTED, TRANSFERRED, DISSEMINATED, REDISTRIBUTED OR RESOLD, OR STORED FOR SUBSEQUENT USE FOR ANY SUCH PURPOSE, IN WHOLE OR IN PART, IN ANY FORM OR MANNER OR BY ANY MEANS WHATSOEVER, BY ANY PERSON WITHOUT MOODY’S PRIOR WRITTEN CONSENT.
Suggested Citation:
Moody’s, Moody's Seasoned Baa Corporate Bond Yield [BAA], retrieved from FRED, Federal Reserve Bank of St. Louis; https://fred.stlouisfed.org/series/BAA, .
Source: U.S. Bureau of Labor Statistics
Release: Consumer Price Index
Units:
Frequency:
Notes:
The Consumer Price Index for All Urban Consumers: All Items (CPIAUCSL) is a price index of a basket of goods and services paid by urban consumers. Percent changes in the price index measure the inflation rate between any two time periods. The most common inflation metric is the percent change from one year ago. It can also represent the buying habits of urban consumers. This particular index includes roughly 88 percent of the total population, accounting for wage earners, clerical workers, technical workers, self-employed, short-term workers, unemployed, retirees, and those not in the labor force.
The CPIs are based on prices for food, clothing, shelter, and fuels; transportation fares; service fees (e.g., water and sewer service); and sales taxes. Prices are collected monthly from about 4,000 housing units and approximately 26,000 retail establishments across 87 urban areas. To calculate the index, price changes are averaged with weights representing their importance in the spending of the particular group. The index measures price changes (as a percent change) from a predetermined reference date. In addition to the original unadjusted index distributed, the Bureau of Labor Statistics also releases a seasonally adjusted index. The unadjusted series reflects all factors that may influence a change in prices. However, it can be very useful to look at the seasonally adjusted CPI, which removes the effects of seasonal changes, such as weather, school year, production cycles, and holidays.
The CPI can be used to recognize periods of inflation and deflation. Significant increases in the CPI within a short time frame might indicate a period of inflation, and significant decreases in CPI within a short time frame might indicate a period of deflation. However, because the CPI includes volatile food and oil prices, it might not be a reliable measure of inflationary and deflationary periods. For a more accurate detection, the core CPI (CPILFESL) is often used. When using the CPI, please note that it is not applicable to all consumers and should not be used to determine relative living costs. Additionally, the CPI is a statistical measure vulnerable to sampling error since it is based on a sample of prices and not the complete average.
For more information on the CPI, see the Handbook of Methods, the release notes and announcements, and the Frequently Asked Questions (FAQs).
Suggested Citation:
U.S. Bureau of Labor Statistics, Consumer Price Index for All Urban Consumers: All Items in U.S. City Average [CPIAUCSL], retrieved from FRED, Federal Reserve Bank of St. Louis; https://fred.stlouisfed.org/series/CPIAUCSL, .
Source: U.S. Bureau of Economic Analysis
Release: Gross Domestic Product
Units:
Frequency:
Notes:
BEA Account Code: A055RC
Suggested Citation:
U.S. Bureau of Economic Analysis, Corporate Profits After Tax (without IVA and CCAdj) [CP], retrieved from FRED, Federal Reserve Bank of St. Louis; https://fred.stlouisfed.org/series/CP, .
Source: U.S. Bureau of Economic Analysis
Release: Gross Domestic Product
Units:
Frequency:
Notes:
BEA Account Code: A191RD
The number of decimal places reported varies over time. A Guide to the National Income and Product Accounts of the United States (NIPA).
Suggested Citation:
U.S. Bureau of Economic Analysis, Gross Domestic Product: Implicit Price Deflator [GDPDEF], retrieved from FRED, Federal Reserve Bank of St. Louis; https://fred.stlouisfed.org/series/GDPDEF, .
Release Tables
Consumer Price Index
Gross Domestic Product
- Table 1.1.5. Gross Domestic Product: Quarterly
- Table 1.1.9. Implicit Price Deflators for Gross Domestic Product: Quarterly
- Table 1.2.5. Gross Domestic Product by Major Type of Product: Quarterly
- Table 1.3.5. Gross Value Added by Sector: Quarterly
- Table 1.4.5. Relation of Gross Domestic Product, Gross Domestic Purchases, and Final Sales to Domestic Purchasers: Quarterly
- Table 1.5.5. Gross Domestic Product, Expanded Detail: Quarterly
- Table 1.7.5. Relation of Gross Domestic Product, Gross National Product, Net National Product, National Income, and Personal Income: Quarterly
- Table 1.12. National Income by Type of Income: Quarterly
- Table 1.17.5. Gross Domestic Product, Gross Domestic Income, and Other Major NIPA Aggregates: Quarterly
H.15 Selected Interest Rates
Related Data and Content
Data Suggestions Based On Your Search


Content Suggestions


Other Formats
Federal Funds Effective Rate
Annual, Not Seasonally Adjusted Biweekly, Not Seasonally Adjusted Daily, Not Seasonally Adjusted Daily, Not Seasonally Adjusted Weekly, Not Seasonally AdjustedFinancial Market: Share Prices for United States
Annual, Not Seasonally Adjusted Quarterly, Not Seasonally AdjustedGross Domestic Product
Annual, Not Seasonally Adjusted Annual, Not Seasonally Adjusted Index 2017=100, Quarterly, Not Seasonally Adjusted Millions of Dollars, Quarterly, Not Seasonally Adjusted Percent Change from Preceding Period, Annual, Not Seasonally Adjusted Percent Change from Preceding Period, Quarterly, Seasonally Adjusted Annual RateMoody's Seasoned Baa Corporate Bond Yield
Daily, Not Seasonally Adjusted Weekly, Not Seasonally AdjustedConsumer Price Index for All Urban Consumers: All Items in U.S. City Average
Monthly, Not Seasonally Adjusted Semiannual, Not Seasonally AdjustedGross Domestic Product: Implicit Price Deflator
Percent Change from Preceding Period, Annual, Not Seasonally Adjusted Percent Change from Preceding Period, Quarterly, Seasonally Adjusted Annual RateRelated Categories
FRB Rates - discount, fed funds, primary credit
Interest Rates
Money, Banking, & Finance
Private Enterprise Income
National Income & Product Accounts
National Accounts
Stock Market Data
Financial Indicators
Money, Banking, & Finance
Indicators
United States
Countries
International Data
GDP/GNP
Corporate Bonds
Consumer Price Indexes (CPI and PCE)
Prices
Price Indexes & Deflators
Releases
More
Series from H.15 Selected Interest Rates
More
Series from Gross Domestic Product
More
Series from Main Economic Indicators
More
Series from Global Financial Development
More
Series from Moody's Daily Corporate Bond Yield Averages
More
Series from Consumer Price Index
Tags
H.15 Selected Interest Rates
Federal
Interest Rate
Interest
Board of Governors
Rate
Monthly
Nation
Public Domain: Citation Requested
United States of America
Not Seasonally Adjusted
Capital Consumption Adjustment
Inventory Valuation Adjustment
Corporate Profits
Tax
Corporate
National Income and Product Accounts
Bureau of Economic Analysis
Gross Domestic Product
Quarterly
Seasonally Adjusted
Stock Market
Main Economic Indicators
Org. for Economic Co-operation and Development
Copyrighted: Citation Required
Market Capitalization
Capital
Global Financial Development
World Bank
Annual
Baa Equity Rating
Moody's Investors Service
Bonds
Yield
Headline Figure
All Items
Average
Urban
Consumer
Consumer Price Index
Inflation
Price Index
Indexes
Price
Bureau of Labor Statistics
Implicit Price Deflator