FRED Graph

Your trusted data source
since 1991.
Source: U.S. Bureau of Economic Analysis
Release: Gross Domestic Product
Units:
Frequency:
BEA Account Code: A191RC
Gross domestic product (GDP), the featured measure of U.S. output, is the market value of the goods and services produced by labor and property located in the United States.For more information, see the Guide to the National Income and Product Accounts of the United States (NIPA) and the Bureau of Economic Analysis.
U.S. Bureau of Economic Analysis, Gross Domestic Product [GDP], retrieved from FRED, Federal Reserve Bank of St. Louis; https://fred.stlouisfed.org/series/GDP, May 2, 2024.
Source: U.S. Department of the Treasury. Fiscal Service
Release: Treasury Bulletin
Units:
Frequency:
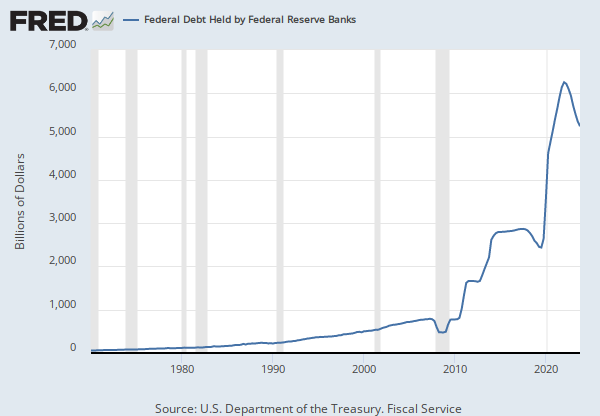
U.S. Department of the Treasury. Fiscal Service, Federal Debt: Total Public Debt [GFDEBTN], retrieved from FRED, Federal Reserve Bank of St. Louis; https://fred.stlouisfed.org/series/GFDEBTN, May 2, 2024.
Source: Wilshire Associates
Release: Wilshire Indexes
Units:
Frequency:
The observations for the Wilshire 5000 Price Index represent the daily index value at market close. The market typically closes at 4 PM ET, except for holidays when it sometimes closes early.
The price indexes are price returns, which do not reinvest dividends. Copyright, 2016, Wilshire Associates Incorporated. Reprinted with permission. For more information about the various indexes, visit Wilshire Associates.
Wilshire Associates, Wilshire 5000 Price Index [WILL5000PR], retrieved from FRED, Federal Reserve Bank of St. Louis; https://fred.stlouisfed.org/series/WILL5000PR, May 2, 2024.
Source: Board of Governors of the Federal Reserve System (US)
Release: H.15 Selected Interest Rates
Units:
Frequency:
For additional historical federal funds rate data, please see Daily Federal Funds Rate from 1928-1954.
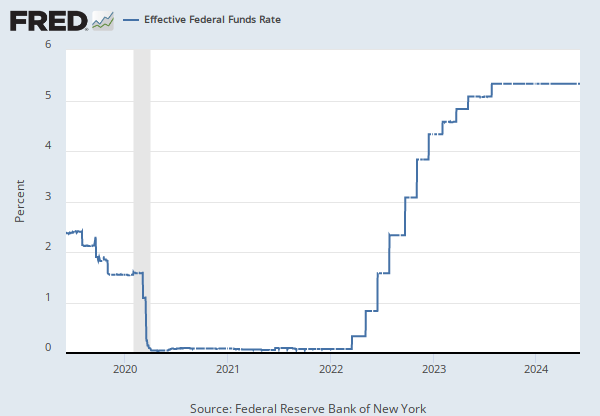
The federal funds rate is the interest rate at which depository institutions trade federal funds (balances held at Federal Reserve Banks) with each other overnight. When a depository institution has surplus balances in its reserve account, it lends to other banks in need of larger balances. In simpler terms, a bank with excess cash, which is often referred to as liquidity, will lend to another bank that needs to quickly raise liquidity. (1) The rate that the borrowing institution pays to the lending institution is determined between the two banks; the weighted average rate for all of these types of negotiations is called the effective federal funds rate.(2) The effective federal funds rate is essentially determined by the market but is influenced by the Federal Reserve through open market operations to reach the federal funds rate target.(2)
The Federal Open Market Committee (FOMC) meets eight times a year to determine the federal funds target rate. As previously stated, this rate influences the effective federal funds rate through open market operations or by buying and selling of government bonds (government debt).(2) More specifically, the Federal Reserve decreases liquidity by selling government bonds, thereby raising the federal funds rate because banks have less liquidity to trade with other banks. Similarly, the Federal Reserve can increase liquidity by buying government bonds, decreasing the federal funds rate because banks have excess liquidity for trade. Whether the Federal Reserve wants to buy or sell bonds depends on the state of the economy. If the FOMC believes the economy is growing too fast and inflation pressures are inconsistent with the dual mandate of the Federal Reserve, the Committee may set a higher federal funds rate target to temper economic activity. In the opposing scenario, the FOMC may set a lower federal funds rate target to spur greater economic activity. Therefore, the FOMC must observe the current state of the economy to determine the best course of monetary policy that will maximize economic growth while adhering to the dual mandate set forth by Congress. In making its monetary policy decisions, the FOMC considers a wealth of economic data, such as: trends in prices and wages, employment, consumer spending and income, business investments, and foreign exchange markets.
The federal funds rate is the central interest rate in the U.S. financial market. It influences other interest rates such as the prime rate, which is the rate banks charge their customers with higher credit ratings. Additionally, the federal funds rate indirectly influences longer- term interest rates such as mortgages, loans, and savings, all of which are very important to consumer wealth and confidence.(2)
References
(1) Federal Reserve Bank of New York. "Federal funds." Fedpoints, August 2007.
(2) Monetary Policy, Board of Governors of the Federal Reserve System.
Board of Governors of the Federal Reserve System (US), Federal Funds Effective Rate [DFF], retrieved from FRED, Federal Reserve Bank of St. Louis; https://fred.stlouisfed.org/series/DFF, May 2, 2024.
Source: U.S. Bureau of Economic Analysis
Release: Personal Income and Outlays
Units:
Frequency:
BEA Account Code: DPCCRG
The Personal Consumption Expenditures Price Index is a measure of the prices that people living in the United States, or those buying on their behalf, pay for goods and services. The change in the PCE price index is known for capturing inflation (or deflation) across a wide range of consumer expenses and reflecting changes in consumer behavior. For example, if car prices rise, car sales may decline while bicycle sales increase.
The PCE Price Index is produced by the Bureau of Economic Analysis (BEA), which revises previously published PCE data to reflect updated information or new methodology, providing consistency across decades of data that's valuable for researchers. They also offer the series as a Chain-Type index and excluding food and energy products, as above. The PCE price index less food excluding food and energy is used primarily for macroeconomic analysis and forecasting future values of the PCE price index.
The PCE Price Index is similar to the Bureau of Labor Statistics' consumer price index for urban consumers. The two indexes, which have their own purposes and uses, are constructed differently, resulting in different inflation rates.
For more information on the PCE price index, see:
U.S. Bureau of Economic Analysis, Guide to the National Income and Product Accounts of the United States (NIPA)
U.S. Bureau of Economic Analysis, Personal Consumption Expenditures Price Index
U.S. Bureau of Economic Analysis, Prices & Inflation
U.S. Bureau of Labor Statistics, Differences between the Consumer Price Index and the Personal Consumption Expenditure Price Index
U.S. Bureau of Economic Analysis, Personal Consumption Expenditures Excluding Food and Energy (Chain-Type Price Index) [PCEPILFE], retrieved from FRED, Federal Reserve Bank of St. Louis; https://fred.stlouisfed.org/series/PCEPILFE, May 2, 2024.
Source: Wilshire Associates
Release: Wilshire Indexes
Units:
Frequency:
The observations for the Wilshire 5000 Total Market Index represent the daily index value at market close. The market typically closes at 4 PM ET, except for holidays when it sometimes closes early.
The total market indexes are total market returns, which do include reinvested dividends. Copyright, 2016, Wilshire Associates Incorporated. Reprinted with permission. For more information about the various indexes, visit Wilshire Associates.
Wilshire Associates, Wilshire 5000 Total Market Index [WILL5000IND], retrieved from FRED, Federal Reserve Bank of St. Louis; https://fred.stlouisfed.org/series/WILL5000IND, May 2, 2024.
Source: NASDAQ OMX Group
Release: NASDAQ
Units:
Frequency:
The observations for the NASDAQ 100 Index represent the daily index value at market close. The market typically closes at 4 PM ET, except for holidays when it sometimes closes early.
The NASDAQ 100 Index includes 100 of the largest domestic and international non-financial securities listed on The NASDAQ Stock Market based on market capitalization.
Copyright © 2016, NASDAQ OMX Group, Inc.
NASDAQ OMX Group, NASDAQ 100 Index [NASDAQ100], retrieved from FRED, Federal Reserve Bank of St. Louis; https://fred.stlouisfed.org/series/NASDAQ100, May 2, 2024.
Source: NASDAQ OMX Group
Release: NASDAQ
Units:
Frequency:
The observations for the NASDAQ Composite Index represent the daily index value at market close. The market typically closes at 4 PM ET, except for holidays when it sometimes closes early.
The NASDAQ Composite Index is a market capitalization weighted index with more than 3000 common equities listed on the NASDAQ Stock Market. The types of securities in the index include American depositary receipts (ADRs), common stocks, real estate investment trusts (REITs), and tracking stocks. The index includes all NASDAQ listed stocks that are not derivatives, preferred shares, funds, exchange-traded funds (ETFs) or debentures.
Copyright © 2016, NASDAQ OMX Group, Inc.
NASDAQ OMX Group, NASDAQ Composite Index [NASDAQCOM], retrieved from FRED, Federal Reserve Bank of St. Louis; https://fred.stlouisfed.org/series/NASDAQCOM, May 2, 2024.
Source: U.S. Office of Management and Budget
Source: Federal Reserve Bank of St. Louis
Release: Debt to Gross Domestic Product Ratios
Units:
Frequency:
Federal Debt: Total Public Debt as Percent of Gross Domestic Product (GFDEGDQ188S) was first constructed by the Federal Reserve Bank of St. Louis in October 2012. It is calculated using Federal Government Debt: Total Public Debt (GFDEBTN) and Gross Domestic Product, 1 Decimal (GDP):
GFDEGDQ188S = ((GFDEBTN/1000)/GDP)*100
GFDEBTN/1000 transforms GFDEBTN from millions of dollars to billions of dollars.
U.S. Office of Management and Budget and Federal Reserve Bank of St. Louis, Federal Debt: Total Public Debt as Percent of Gross Domestic Product [GFDEGDQ188S], retrieved from FRED, Federal Reserve Bank of St. Louis; https://fred.stlouisfed.org/series/GFDEGDQ188S, May 2, 2024.
Gross Domestic Product
Annual, Not Seasonally Adjusted Annual, Not Seasonally Adjusted Index 2017=100, Quarterly, Not Seasonally Adjusted Millions of Dollars, Quarterly, Not Seasonally Adjusted Percent Change from Preceding Period, Annual, Not Seasonally Adjusted Percent Change from Preceding Period, Quarterly, Seasonally Adjusted Annual RateFederal Funds Effective Rate
Annual, Not Seasonally Adjusted Biweekly, Not Seasonally Adjusted Daily, Not Seasonally Adjusted Monthly, Not Seasonally Adjusted Weekly, Not Seasonally AdjustedPersonal Consumption Expenditures Excluding Food and Energy (Chain-Type Price Index)
Percent Change from Quarter One Year Ago, Quarterly, Seasonally Adjusted