Federal Reserve Economic Data
Notes
Source: International Monetary Fund
Release: Financial Soundness Indicators
Units:
Frequency:
Notes:
This series covers commercial real estate price indices. Currently, there is limited international experience in constructing representative real estate price indices as real estate markets are heterogeneous, both within and across countries, and illiquid. A rapid increase in real estate prices, followed by a sharp economic downturn, can have a detrimental effect on financial sector soundness by affecting credit quality and the value of collateral.
Copyright © 2016, International Monetary Fund. Reprinted with permission. Complete terms of use and contact details are available at http://www.imf.org/external/terms.htm.
Suggested Citation:
International Monetary Fund, Commercial Real Estate Prices for United States [COMREPUSQ159N], retrieved from FRED, Federal Reserve Bank of St. Louis; https://fred.stlouisfed.org/series/COMREPUSQ159N, .
Source: U.S. Bureau of Labor Statistics
Release: Consumer Price Index
Units:
Frequency:
Notes:
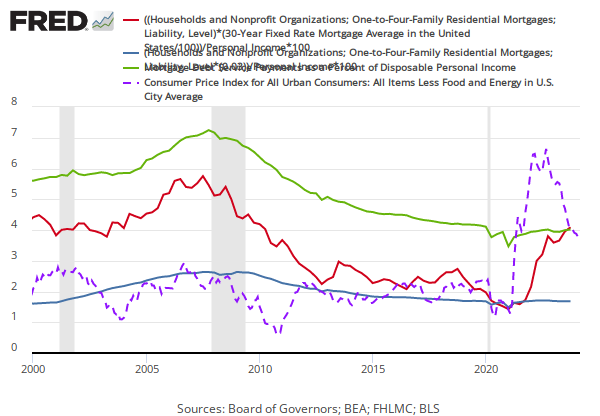
The "Consumer Price Index for All Urban Consumers: All Items Less Food & Energy" is an aggregate of prices paid by urban consumers for a typical basket of goods, excluding food and energy. This measurement, known as "Core CPI," is widely used by economists because food and energy have very volatile prices. The Bureau of Labor Statistics defines and measures the official CPI, and more information can be found in the FAQ or in this article.
Suggested Citation:
U.S. Bureau of Labor Statistics, Consumer Price Index for All Urban Consumers: All Items Less Food and Energy in U.S. City Average [CPILFESL], retrieved from FRED, Federal Reserve Bank of St. Louis; https://fred.stlouisfed.org/series/CPILFESL, .
Source: S&P Dow Jones Indices LLC
Release: S&P Cotality Case-Shiller Home Price Indices
Units:
Frequency:
Notes:
For more information regarding the index, please visit Standard & Poor's. There is more information about home price sales pairs in the Methodology section. Copyright, 2016, Standard & Poor's Financial Services LLC. Reprinted with permission.
Suggested Citation:
S&P Dow Jones Indices LLC, S&P Cotality Case-Shiller U.S. National Home Price Index [CSUSHPINSA], retrieved from FRED, Federal Reserve Bank of St. Louis; https://fred.stlouisfed.org/series/CSUSHPINSA, .
Release Tables
Consumer Price Index
S&P Cotality Case-Shiller Home Price Indices
Related Data and Content
Data Suggestions Based On Your Search


Content Suggestions


Other Formats
Consumer Price Index for All Urban Consumers: All Items Less Food and Energy in U.S. City Average
Monthly, Not Seasonally Adjusted Semiannual, Not Seasonally AdjustedS&P Cotality Case-Shiller U.S. National Home Price Index
Monthly, Seasonally AdjustedRelated Categories
Real Estate
Production & Business Activity
Indicators
United States
Countries
International Data
Special Indexes
Consumer Price Indexes (CPI and PCE)
Prices
House Price Indexes
Releases
More
Series from Financial Soundness Indicators
More
Series from Consumer Price Index
More
Series from S&P Cotality Case-Shiller Home Price Indices
Tags
Real Estate
Commercial
International Monetary Fund
Rate
Quarterly
Copyrighted: Citation Required
Nation
United States of America
Not Seasonally Adjusted
Core Inflation
Headline Figure
All Items
Urban
Consumer
Consumer Price Index
Inflation
Price Index
Indexes
Price
Seasonally Adjusted
Bureau of Labor Statistics
Monthly
Public Domain: Citation Requested
S&P Cotality Case-Shiller Home Price Indices
S&P Dow Jones Indices LLC
Copyrighted: Pre-Approval Required
House Price Index
Housing