Notes
Source: U.S. Bureau of Labor Statistics
Release: Consumer Price Index
Units:
Frequency:
Notes:
Handbook of Methods
Understanding the CPI: Frequently Asked Questions
Suggested Citation:
U.S. Bureau of Labor Statistics, Consumer Price Index for All Urban Consumers: All Items in U.S. City Average [CPIAUCNS], retrieved from FRED, Federal Reserve Bank of St. Louis; https://fred.stlouisfed.org/series/CPIAUCNS, .
Source: U.S. Bureau of Economic Analysis
Release: Personal Income and Outlays
Units:
Frequency:
Notes:
BEA Account Code: DPCERG
The Personal Consumption Expenditures Price Index is a measure of the prices that people living in the United States, or those buying on their behalf, pay for goods and services. The change in the PCE price index is known for capturing inflation (or deflation) across a wide range of consumer expenses and reflecting changes in consumer behavior. For example, if the price of beef rises, shoppers may buy less beef and more chicken.
The PCE Price Index is produced by the Bureau of Economic Analysis (BEA), which revises previously published PCE data to reflect updated information or new methodology, providing consistency across decades of data that's valuable for researchers. They also offer the series as a Chain-Type index, as above. The PCE price index is used primarily for macroeconomic analysis and forecasting.
The PCE Price index is the Federal Reserve’s preferred measure of inflation. The PCE Price Index is similar to the Bureau of Labor Statistics' consumer price index for urban consumers. The two indexes, which have their own purposes and uses, are constructed differently, resulting in different inflation rates.
For more information on the PCE price index, see:
U.S. Bureau of Economic Analysis, Guide to the National Income and Product Accounts of the United States (NIPA)
U.S. Bureau of Economic Analysis, Personal Consumption Expenditures Price Index
U.S. Bureau of Economic Analysis, Prices & Inflation
U.S. Bureau of Labor Statistics, Differences between the Consumer Price Index and the Personal Consumption Expenditure Price Index
Suggested Citation:
U.S. Bureau of Economic Analysis, Personal Consumption Expenditures: Chain-type Price Index [PCEPI], retrieved from FRED, Federal Reserve Bank of St. Louis; https://fred.stlouisfed.org/series/PCEPI, .
Source: U.S. Bureau of Economic Analysis
Release: Gross Domestic Product
Units:
Frequency:
Notes:
BEA Account Code: A191RD
The number of decimal places reported varies over time. A Guide to the National Income and Product Accounts of the United States (NIPA).
Suggested Citation:
U.S. Bureau of Economic Analysis, Gross Domestic Product: Implicit Price Deflator [GDPDEF], retrieved from FRED, Federal Reserve Bank of St. Louis; https://fred.stlouisfed.org/series/GDPDEF, .
Source: U.S. Bureau of Labor Statistics
Release: Employment Situation
Units:
Frequency:
Notes:
Production and related employees include working supervisors and all nonsupervisory employees (including group leaders and trainees) engaged in fabricating, processing, assembling, inspecting, receiving, storing, handling, packing, warehousing, shipping, trucking, hauling, maintenance, repair, janitorial, guard services, product development, auxiliary production for plant's own use (for example, power plant), recordkeeping, and other services closely associated with the above production operations.
#Nonsupervisory employees include those individuals in private, service-providing industries who are not above the working-supervisor level. This group includes individuals such as office and clerical workers, repairers, salespersons, operators, drivers, physicians, lawyers, accountants, nurses, social workers, research aides, teachers, drafters, photographers, beauticians, musicians, restaurant workers, custodial workers, attendants, line installers and repairers, laborers, janitors, guards, and other employees at similar occupational levels whose services are closely associated with those of the employees listed.
The series comes from the 'Current Employment Statistics (Establishment Survey).'
The source code is: CES0500000008
Suggested Citation:
U.S. Bureau of Labor Statistics, Average Hourly Earnings of Production and Nonsupervisory Employees, Total Private [AHETPI], retrieved from FRED, Federal Reserve Bank of St. Louis; https://fred.stlouisfed.org/series/AHETPI, .
Source: U.S. Bureau of Labor Statistics
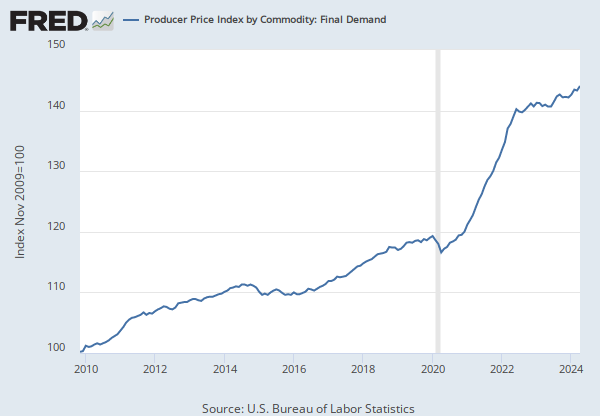
Release: Producer Price Index
Units:
Frequency:
Suggested Citation:
U.S. Bureau of Labor Statistics, Producer Price Index by Commodity: All Commodities [PPIACO], retrieved from FRED, Federal Reserve Bank of St. Louis; https://fred.stlouisfed.org/series/PPIACO, .
Source: U.S. Bureau of Labor Statistics
Release: Producer Price Index
Units:
Frequency:
Suggested Citation:
U.S. Bureau of Labor Statistics, Producer Price Index by Commodity: Final Demand: Finished Goods [WPSFD49207], retrieved from FRED, Federal Reserve Bank of St. Louis; https://fred.stlouisfed.org/series/WPSFD49207, .
Release Tables
Consumer Price Index
Employment Situation
Gross Domestic Product
Personal Income and Outlays
Producer Price Index
Related Data and Content
Data Suggestions Based On Your Search


Content Suggestions


Other Formats
Consumer Price Index for All Urban Consumers: All Items in U.S. City Average
Monthly, Seasonally Adjusted Semiannual, Not Seasonally AdjustedPersonal Consumption Expenditures: Chain-type Price Index
Annual, Not Seasonally Adjusted Quarterly, Seasonally AdjustedGross Domestic Product: Implicit Price Deflator
Percent Change from Preceding Period, Annual, Not Seasonally Adjusted Percent Change from Preceding Period, Quarterly, Seasonally Adjusted Annual RateAverage Hourly Earnings of Production and Nonsupervisory Employees, Total Private
Monthly, Not Seasonally AdjustedProducer Price Index by Commodity: Final Demand: Finished Goods
Monthly, Not Seasonally AdjustedRelated Categories
Consumer Price Indexes (CPI and PCE)
Prices
Price Indexes & Deflators
National Income & Product Accounts
National Accounts
Total Private
Current Employment Statistics (Establishment Survey)
Population, Employment, & Labor Markets
Producer Price Indexes (PPI)
Final Demand
Commodity Based
Releases
More
Series from Consumer Price Index
More
Series from Personal Income and Outlays
More
Series from Gross Domestic Product
More
Series from Employment Situation
More
Series from Producer Price Index
Tags
All Items
Urban
Consumer
Consumer Price Index
Inflation
Price Index
Indexes
Price
Bureau of Labor Statistics
Monthly
Nation
Public Domain: Citation Requested
United States of America
Not Seasonally Adjusted
Chained
Headline Figure
Personal Consumption Expenditures
Consumption Expenditures
Consumption
Personal
National Income and Product Accounts
Bureau of Economic Analysis
Seasonally Adjusted
Implicit Price Deflator
Gross Domestic Product
Quarterly
Nonsupervisory
Current Employment Statistics Survey (Establishment Survey)
Average
Earnings
Hours
Wages
Production
Private
Employment
Commodities
Producer Price Index
Finished
Final Demand
Goods