Notes
Source: Board of Governors of the Federal Reserve System (US)
Release: H.15 Selected Interest Rates
Units:
Frequency:
Notes:
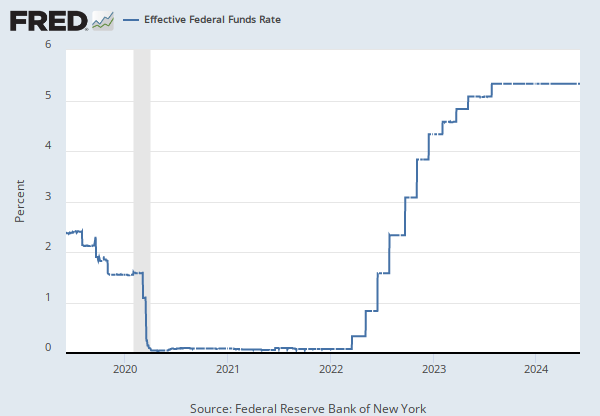
For additional historical federal funds rate data, please see Daily Federal Funds Rate from 1928-1954.
The federal funds rate is the interest rate at which depository institutions trade federal funds (balances held at Federal Reserve Banks) with each other overnight. When a depository institution has surplus balances in its reserve account, it lends to other banks in need of larger balances. In simpler terms, a bank with excess cash, which is often referred to as liquidity, will lend to another bank that needs to quickly raise liquidity. (1) The rate that the borrowing institution pays to the lending institution is determined between the two banks; the weighted average rate for all of these types of negotiations is called the effective federal funds rate.(2) The effective federal funds rate is essentially determined by the market but is influenced by the Federal Reserve as it uses the Interest on Reserve Balances rate to steer the federal funds rate toward the target range.(2)
The Federal Open Market Committee (FOMC) meets eight times a year to determine the federal funds target range. The Fed's primary tool for influencing the federal funds rate is the interest the Fed pays on the funds that banks hold as reserve balances at their Federal Reserve Bank, which is the Interest on Reserves Balances (IORB) rate. Because banks are unlikely to lend funds in the federal funds market for less than they get paid in their reserve balance account at the Federal Reserve, the Interest on Reserve Balances (IORB) is an effective tool for guiding the federal funds rate. (3) Whether the Federal Reserve raises or lowers the target range for the federal funds rate depends on the state of the economy. If the FOMC believes the economy is growing too fast and inflation pressures are inconsistent with the dual mandate of the Federal Reserve, the Committee may temper economic activity by raising the target range for federal funds rate, and increasing the IORB rate to steer the federal funds rate into the target range. In the opposing scenario, the FOMC may spur greater economic activity by lowering the target range for federal funds rate, and decreasing the IORB rate to steer the federal funds rate into the target range. (3) Therefore, the FOMC must observe the current state of the economy to determine the best course of monetary policy that will maximize economic growth while adhering to the dual mandate set forth by Congress. In making its monetary policy decisions, the FOMC considers a wealth of economic data, such as: trends in prices and wages, employment, consumer spending and income, business investments, and foreign exchange markets.
The federal funds rate is the central interest rate in the U.S. financial market. It influences other interest rates such as the prime rate, which is the rate banks charge their customers with higher credit ratings. Additionally, the federal funds rate indirectly influences longer- term interest rates such as mortgages, loans, and savings, all of which are very important to consumer wealth and confidence.(2)
References
(1) Federal Reserve Bank of New York. "Federal funds." Fedpoints, August 2007.
(2) Monetary Policy, Board of Governors of the Federal Reserve System.
(3) The Fed Explained, Board of Governors of the Federal Reserve System
For further information, see The Fed's New Monetary Policy Tools, Page One Economics, Federal Reserve Bank of St. Louis.
For questions on the data, please contact the data source. For questions on FRED functionality, please contact us here.
Suggested Citation:
Board of Governors of the Federal Reserve System (US), Federal Funds Effective Rate [DFF], retrieved from FRED, Federal Reserve Bank of St. Louis; https://fred.stlouisfed.org/series/DFF, .
Source: Federal Reserve Bank of St. Louis
Release: Interest Rate Spreads
Units:
Frequency:
Notes:
The breakeven inflation rate represents a measure of expected inflation derived from 10-Year Treasury Constant Maturity Securities (DGS10) and 10-Year Treasury Inflation-Indexed Constant Maturity Securities (DFII10). The latest value implies what market participants expect inflation to be in the next 10 years, on average.
Starting with the update on June 21, 2019, the Treasury bond data used in calculating interest rate spreads is obtained directly from the U.S. Treasury Department.
Suggested Citation:
Federal Reserve Bank of St. Louis, 10-Year Breakeven Inflation Rate [T10YIE], retrieved from FRED, Federal Reserve Bank of St. Louis; https://fred.stlouisfed.org/series/T10YIE, .
Source: Federal Reserve Bank of St. Louis
Release: Interest Rate Spreads
Units:
Frequency:
Notes:
The breakeven inflation rate represents a measure of expected inflation derived from 5-Year Treasury Constant Maturity Securities (DGS5) and 5-Year Treasury Inflation-Indexed Constant Maturity Securities (DFII5). The latest value implies what market participants expect inflation to be in the next 5 years, on average.
Starting with the update on June 21, 2019, the Treasury bond data used in calculating interest rate spreads is obtained directly from the U.S. Treasury Department.
Suggested Citation:
Federal Reserve Bank of St. Louis, 5-Year Breakeven Inflation Rate [T5YIE], retrieved from FRED, Federal Reserve Bank of St. Louis; https://fred.stlouisfed.org/series/T5YIE, .
Source: Federal Reserve Bank of St. Louis
Release: Interest Rate Spreads
Units:
Frequency:
Notes:
This series is a measure of expected inflation (on average) over the five-year period that begins five years from today.
This series is constructed as:
(((((1+((BC_10YEAR-TC_10YEAR)/100))^10)/((1+((BC_5YEAR-TC_5YEAR)/100))^5))^0.2)-1)*100
where BC10_YEAR, TC_10YEAR, BC_5YEAR, and TC_5YEAR are the 10 year and 5 year nominal and inflation adjusted Treasury securities.
Starting with the update on June 21, 2019, the Treasury bond data used in calculating interest rate spreads is obtained directly from the U.S. Treasury Department.
Suggested Citation:
Federal Reserve Bank of St. Louis, 5-Year, 5-Year Forward Inflation Expectation Rate [T5YIFR], retrieved from FRED, Federal Reserve Bank of St. Louis; https://fred.stlouisfed.org/series/T5YIFR, .
Source: World Bank
Release: World Development Indicators
Units:
Frequency:
Notes:
Inflation as measured by the consumer price index reflects the annual percentage change in the cost to the average consumer of acquiring a basket of goods and services that may be fixed or changed at specified intervals, such as yearly. The Laspeyres formula is generally used.
International Monetary Fund, International Financial Statistics and data files.
Suggested Citation:
World Bank, Inflation, consumer prices for the United States [FPCPITOTLZGUSA], retrieved from FRED, Federal Reserve Bank of St. Louis; https://fred.stlouisfed.org/series/FPCPITOTLZGUSA, .
Source: Board of Governors of the Federal Reserve System (US)
Release: H.15 Selected Interest Rates
Units:
Frequency:
Notes:
Yields on actively traded non-inflation-indexed issues adjusted to constant maturities. The 30-year Treasury constant maturity series was discontinued on February 18, 2002, and reintroduced on February 9, 2006.
For further information regarding treasury constant maturity data, please refer to the H.15 Statistical Release notes and the Treasury Yield Curve Methodology.
For questions on the data, please contact the data source. For questions on FRED functionality, please contact us here.
Suggested Citation:
Board of Governors of the Federal Reserve System (US), Market Yield on U.S. Treasury Securities at 30-Year Constant Maturity, Quoted on an Investment Basis [DGS30], retrieved from FRED, Federal Reserve Bank of St. Louis; https://fred.stlouisfed.org/series/DGS30, .
Source: Board of Governors of the Federal Reserve System (US)
Release: H.15 Selected Interest Rates
Units:
Frequency:
Notes:
For further information regarding treasury constant maturity data, please refer to the H.15 Statistical Release notes and the Treasury Yield Curve Methodology.
For questions on the data, please contact the data source. For questions on FRED functionality, please contact us here.
Suggested Citation:
Board of Governors of the Federal Reserve System (US), Market Yield on U.S. Treasury Securities at 20-Year Constant Maturity, Quoted on an Investment Basis [DGS20], retrieved from FRED, Federal Reserve Bank of St. Louis; https://fred.stlouisfed.org/series/DGS20, .
Source: Board of Governors of the Federal Reserve System (US)
Release: H.15 Selected Interest Rates
Units:
Frequency:
Notes:
For further information regarding treasury constant maturity data, please refer to the H.15 Statistical Release notes and the Treasury Yield Curve Methodology.
For questions on the data, please contact the data source. For questions on FRED functionality, please contact us here.
Suggested Citation:
Board of Governors of the Federal Reserve System (US), Market Yield on U.S. Treasury Securities at 1-Year Constant Maturity, Quoted on an Investment Basis [DGS1], retrieved from FRED, Federal Reserve Bank of St. Louis; https://fred.stlouisfed.org/series/DGS1, .
Source: U.S. Bureau of Labor Statistics
Release: Producer Price Index
Units:
Frequency:
Suggested Citation:
U.S. Bureau of Labor Statistics, Producer Price Index by Industry: Frozen Fruit and Vegetable Manufacturing: Frozen Fruits [PCU31141131141111], retrieved from FRED, Federal Reserve Bank of St. Louis; https://fred.stlouisfed.org/series/PCU31141131141111, .
Source: U.S. Bureau of Economic Analysis
Release: Personal Income and Outlays
Units:
Frequency:
Notes:
BEA Account Code: DFXARC
For more information about this series, please see http://www.bea.gov/national/.
Suggested Citation:
U.S. Bureau of Economic Analysis, Personal consumption expenditures: Food [DFXARC1M027SBEA], retrieved from FRED, Federal Reserve Bank of St. Louis; https://fred.stlouisfed.org/series/DFXARC1M027SBEA, .
Source: U.S. Bureau of Labor Statistics
Release: Consumer Price Index
Units:
Frequency:
Notes:
Handbook of Methods - (https://www.bls.gov/opub/hom/pdf/cpihom.pdf) Understanding the CPI: Frequently Asked Questions - (http://stats.bls.gov:80/cpi/cpifaq.htm)
Suggested Citation:
U.S. Bureau of Labor Statistics, Consumer Price Index for All Urban Consumers: Food in U.S. City Average [CPIUFDNS], retrieved from FRED, Federal Reserve Bank of St. Louis; https://fred.stlouisfed.org/series/CPIUFDNS, .
Source: S&P Dow Jones Indices LLC
Release: Dow Jones Averages
Units:
Frequency:
Notes:
The observations for the Dow Jones Industrial Average represent the daily index value at market close. The market typically closes at 4 PM ET, except for holidays when it sometimes closes early.
The Dow Jones Industrial Average provides a view of the US stock market and economy. Originally, the index was made up of 12 stocks, it now contains 30 component companies in various industries. See indexology for more information.
Copyright © 2016, S&P Dow Jones Indices LLC. All rights reserved. Reproduction of Dow Jones Industrial Average in any form is prohibited except with the prior written permission of S&P Dow Jones Indices LLC ("S&P"). S&P does not guarantee the accuracy, adequacy, completeness or availability of any information and is not responsible for any errors or omissions, regardless of the cause or for the results obtained from the use of such information. S&P DISCLAIMS ANY AND ALL EXPRESS OR IMPLIED WARRANTIES, INCLUDING, BUT NOT LIMITED TO, ANY WARRANTIES OF MERCHANTABILITY OR FITNESS FOR A PARTICULAR PURPOSE OR USE. In no event shall S&P be liable for any direct, indirect, special or consequential damages, costs, expenses, legal fees, or losses (including lost income or lost profit and opportunity costs) in connection with subscriber's or others' use of Dow Jones Industrial Average.
Permission to reproduce this series can be requested from index_services@spdji.com. More contact details are available here, including phone numbers for all regional offices.
Suggested Citation:
S&P Dow Jones Indices LLC, Dow Jones Industrial Average [DJIA], retrieved from FRED, Federal Reserve Bank of St. Louis; https://fred.stlouisfed.org/series/DJIA, .
Release Tables
Consumer Price Index
H.15 Selected Interest Rates
Personal Income and Outlays
Producer Price Index
Related Data and Content
Data Suggestions Based On Your Search


Content Suggestions


Other Formats
Federal Funds Effective Rate
Annual, Not Seasonally Adjusted Biweekly, Not Seasonally Adjusted Daily, Not Seasonally Adjusted Monthly, Not Seasonally Adjusted Weekly, Not Seasonally Adjusted10-Year Breakeven Inflation Rate
Monthly, Not Seasonally Adjusted5-Year Breakeven Inflation Rate
Monthly, Not Seasonally Adjusted5-Year, 5-Year Forward Inflation Expectation Rate
Monthly, Not Seasonally AdjustedMarket Yield on U.S. Treasury Securities at 30-Year Constant Maturity, Quoted on an Investment Basis
Annual, Not Seasonally Adjusted Monthly, Not Seasonally Adjusted Weekly, Not Seasonally AdjustedMarket Yield on U.S. Treasury Securities at 20-Year Constant Maturity, Quoted on an Investment Basis
Annual, Not Seasonally Adjusted Monthly, Not Seasonally Adjusted Weekly, Not Seasonally AdjustedMarket Yield on U.S. Treasury Securities at 1-Year Constant Maturity, Quoted on an Investment Basis
Annual, Not Seasonally Adjusted Monthly, Not Seasonally Adjusted Weekly, Not Seasonally AdjustedConsumer Price Index for All Urban Consumers: Food in U.S. City Average
Monthly, Seasonally Adjusted Semiannual, Not Seasonally AdjustedRelated Categories
FRB Rates - discount, fed funds, primary credit
Interest Rates
Money, Banking, & Finance
Interest Rate Spreads
United States
Countries
International Data
Treasury Constant Maturity
Manufacturing
Industry Based
Producer Price Indexes (PPI)
Prices
Personal Consumption Expenditures
Personal Income & Outlays
National Income & Product Accounts
National Accounts
Food and Beverages
Consumer Price Indexes (CPI and PCE)
Stock Market Indexes
Financial Indicators
Releases
More
Series from H.15 Selected Interest Rates
More
Series from Interest Rate Spreads
More
Series from World Development Indicators
More
Series from Producer Price Index
More
Series from Personal Income and Outlays
More
Series from Consumer Price Index
More
Series from Dow Jones Averages
Tags
H.15 Selected Interest Rates
Federal
Interest Rate
Interest
Daily
Board of Governors
Rate
Nation
Public Domain: Citation Requested
United States of America
Not Seasonally Adjusted
Spread
10-Year
St. Louis Fed
Inflation
Copyrighted: Citation Required
5-Year
Consumer
Consumer Price Index
World Development Indicators
World Bank
Price Index
Indexes
Price
Annual
30-Year
Maturity
Treasury
20-Year
1-Year
Fruits
Vegetables
Manufacturing
Producer Price Index
Industry
Bureau of Labor Statistics
Monthly
Personal Consumption Expenditures
Food
Consumption Expenditures
Consumption
Personal
National Income and Product Accounts
Bureau of Economic Analysis
Seasonally Adjusted
Urban
Dow Jones Averages
Dow Jones & Company
S&P Dow Jones Indices LLC
Stock Market
Average
Copyrighted: Pre-Approval Required