Notes
Source: Federal Reserve Bank of Cleveland
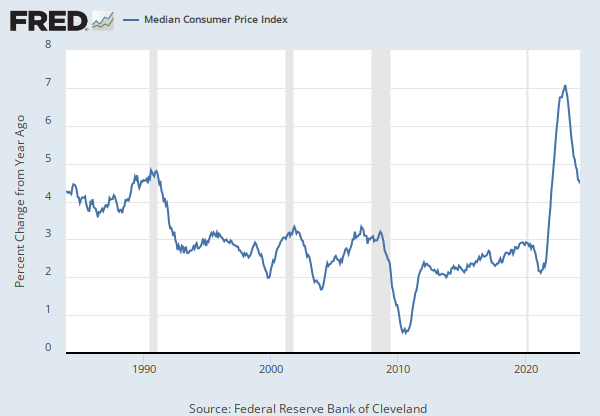
Release: Current Median CPI
Units:
Frequency:
Notes:
Median Consumer Price Index (CPI) is a measure of core inflation calculated the Federal Reserve Bank of Cleveland and the Ohio State University. Median CPI was created as a different way to get a 'Core CPI' measure, or a better measure of underlying inflation trends. To calculate the Median CPI, the Cleveland Fed analyzes the median price change of the goods and services published by the BLS. The median price change is the price change that's right in the middle of the long list of all of the price changes. This series excludes 49.5% of the CPI components with the highest and lowest one-month price changes from each tail of the price-change distribution resulting in a Median CPI Inflation Estimate.
According to research from the Cleveland Fed, the Median CPI provides a better signal of the inflation trend than either the all-items CPI or the CPI excluding food and energy. According to newer research done at the Cleveland Fed, the Median CPI is even better at PCE inflation in the near and longer term than the core PCE.
For further information, visit The Federal Reserve Bank of Cleveland.
Suggested Citation:
Federal Reserve Bank of Cleveland, Median Consumer Price Index [MEDCPIM158SFRBCLE], retrieved from FRED, Federal Reserve Bank of St. Louis; https://fred.stlouisfed.org/series/MEDCPIM158SFRBCLE, .
Source: U.S. Bureau of Labor Statistics
Release: Consumer Price Index
Units:
Frequency:
Notes:
The Consumer Price Index for All Urban Consumers: All Items (CPIAUCSL) is a price index of a basket of goods and services paid by urban consumers. Percent changes in the price index measure the inflation rate between any two time periods. The most common inflation metric is the percent change from one year ago. It can also represent the buying habits of urban consumers. This particular index includes roughly 88 percent of the total population, accounting for wage earners, clerical workers, technical workers, self-employed, short-term workers, unemployed, retirees, and those not in the labor force.
The CPIs are based on prices for food, clothing, shelter, and fuels; transportation fares; service fees (e.g., water and sewer service); and sales taxes. Prices are collected monthly from about 4,000 housing units and approximately 26,000 retail establishments across 87 urban areas. To calculate the index, price changes are averaged with weights representing their importance in the spending of the particular group. The index measures price changes (as a percent change) from a predetermined reference date. In addition to the original unadjusted index distributed, the Bureau of Labor Statistics also releases a seasonally adjusted index. The unadjusted series reflects all factors that may influence a change in prices. However, it can be very useful to look at the seasonally adjusted CPI, which removes the effects of seasonal changes, such as weather, school year, production cycles, and holidays.
The CPI can be used to recognize periods of inflation and deflation. Significant increases in the CPI within a short time frame might indicate a period of inflation, and significant decreases in CPI within a short time frame might indicate a period of deflation. However, because the CPI includes volatile food and oil prices, it might not be a reliable measure of inflationary and deflationary periods. For a more accurate detection, the core CPI (CPILFESL) is often used. When using the CPI, please note that it is not applicable to all consumers and should not be used to determine relative living costs. Additionally, the CPI is a statistical measure vulnerable to sampling error since it is based on a sample of prices and not the complete average.
For more information on the CPI, see the Handbook of Methods, the release notes and announcements, and the Frequently Asked Questions (FAQs).
Suggested Citation:
U.S. Bureau of Labor Statistics, Consumer Price Index for All Urban Consumers: All Items in U.S. City Average [CPIAUCSL], retrieved from FRED, Federal Reserve Bank of St. Louis; https://fred.stlouisfed.org/series/CPIAUCSL, .
Source: U.S. Bureau of Labor Statistics
Release: Consumer Price Index
Units:
Frequency:
Notes:
The "Consumer Price Index for All Urban Consumers: All Items Less Food & Energy" is an aggregate of prices paid by urban consumers for a typical basket of goods, excluding food and energy. This measurement, known as "Core CPI," is widely used by economists because food and energy have very volatile prices. The Bureau of Labor Statistics defines and measures the official CPI, and more information can be found in the FAQ or in this article.
Suggested Citation:
U.S. Bureau of Labor Statistics, Consumer Price Index for All Urban Consumers: All Items Less Food and Energy in U.S. City Average [CPILFESL], retrieved from FRED, Federal Reserve Bank of St. Louis; https://fred.stlouisfed.org/series/CPILFESL, .
Source: U.S. Bureau of Economic Analysis
Release: Personal Income and Outlays
Units:
Frequency:
Notes:
BEA Account Code: DPCERG
The Personal Consumption Expenditures Price Index is a measure of the prices that people living in the United States, or those buying on their behalf, pay for goods and services. The change in the PCE price index is known for capturing inflation (or deflation) across a wide range of consumer expenses and reflecting changes in consumer behavior. For example, if the price of beef rises, shoppers may buy less beef and more chicken.
The PCE Price Index is produced by the Bureau of Economic Analysis (BEA), which revises previously published PCE data to reflect updated information or new methodology, providing consistency across decades of data that's valuable for researchers. They also offer the series as a Chain-Type index, as above. The PCE price index is used primarily for macroeconomic analysis and forecasting.
The PCE Price index is the Federal Reserve’s preferred measure of inflation. The PCE Price Index is similar to the Bureau of Labor Statistics' consumer price index for urban consumers. The two indexes, which have their own purposes and uses, are constructed differently, resulting in different inflation rates.
For more information on the PCE price index, see:
U.S. Bureau of Economic Analysis, Guide to the National Income and Product Accounts of the United States (NIPA)
U.S. Bureau of Economic Analysis, Personal Consumption Expenditures Price Index
U.S. Bureau of Economic Analysis, Prices & Inflation
U.S. Bureau of Labor Statistics, Differences between the Consumer Price Index and the Personal Consumption Expenditure Price Index
Suggested Citation:
U.S. Bureau of Economic Analysis, Personal Consumption Expenditures: Chain-type Price Index [PCEPI], retrieved from FRED, Federal Reserve Bank of St. Louis; https://fred.stlouisfed.org/series/PCEPI, .
Source: U.S. Bureau of Economic Analysis
Release: Personal Income and Outlays
Units:
Frequency:
Notes:
BEA Account Code: DPCCRG
The Personal Consumption Expenditures Price Index is a measure of the prices that people living in the United States, or those buying on their behalf, pay for goods and services. The change in the PCE price index is known for capturing inflation (or deflation) across a wide range of consumer expenses and reflecting changes in consumer behavior. For example, if car prices rise, car sales may decline while bicycle sales increase.
The PCE Price Index is produced by the Bureau of Economic Analysis (BEA), which revises previously published PCE data to reflect updated information or new methodology, providing consistency across decades of data that's valuable for researchers. They also offer the series as a Chain-Type index and excluding food and energy products, as above. The PCE price index less food excluding food and energy is used primarily for macroeconomic analysis and forecasting future values of the PCE price index.
The PCE Price Index is similar to the Bureau of Labor Statistics' consumer price index for urban consumers. The two indexes, which have their own purposes and uses, are constructed differently, resulting in different inflation rates.
For more information on the PCE price index, see:
U.S. Bureau of Economic Analysis, Guide to the National Income and Product Accounts of the United States (NIPA)
U.S. Bureau of Economic Analysis, Personal Consumption Expenditures Price Index
U.S. Bureau of Economic Analysis, Prices & Inflation
U.S. Bureau of Labor Statistics, Differences between the Consumer Price Index and the Personal Consumption Expenditure Price Index
Suggested Citation:
U.S. Bureau of Economic Analysis, Personal Consumption Expenditures Excluding Food and Energy (Chain-Type Price Index) [PCEPILFE], retrieved from FRED, Federal Reserve Bank of St. Louis; https://fred.stlouisfed.org/series/PCEPILFE, .
Source: Federal Reserve Bank of Cleveland
Release: Current Median CPI
Units:
Frequency:
Notes:
16% Trimmed-Mean Consumer Price Index (CPI) is a measure of core inflation calculated by the Federal Reserve Bank of Cleveland. The Trimmed-Mean CPI excludes the CPI components that show the most extreme monthly price changes. This series excludes 8% of the CPI components with the highest and lowest one-month price changes from each tail of the price-change distribution resulting in a 16% Trimmed-Mean Inflation Estimate.
For further information, visit The Federal Reserve Bank of Cleveland.
Suggested Citation:
Federal Reserve Bank of Cleveland, 16% Trimmed-Mean Consumer Price Index [TRMMEANCPIM158SFRBCLE], retrieved from FRED, Federal Reserve Bank of St. Louis; https://fred.stlouisfed.org/series/TRMMEANCPIM158SFRBCLE, .
Source: Federal Reserve Bank of Atlanta
Release: Sticky Price CPI
Units:
Frequency:
Notes:
The Sticky Price Consumer Price Index (CPI) is calculated from a subset of goods and services included in the CPI that change price relatively infrequently. Because these goods and services change price relatively infrequently, they are thought to incorporate expectations about future inflation to a greater degree than prices that change on a more frequent basis. One possible explanation for sticky prices could be the costs firms incur when changing price.
To obtain more information about this release see: Michael F. Bryan, and Brent H. Meyer. “Are Some Prices in the CPI More Forward Looking Than Others? We Think So.” Economic Commentary (Federal Reserve Bank of Cleveland) (May 19, 2010): 1–6. https://doi.org/10.26509/frbc-ec-201002.
Suggested Citation:
Federal Reserve Bank of Atlanta, Sticky Price Consumer Price Index less Food and Energy [CORESTICKM159SFRBATL], retrieved from FRED, Federal Reserve Bank of St. Louis; https://fred.stlouisfed.org/series/CORESTICKM159SFRBATL, .
Source: U.S. Bureau of Labor Statistics
Release: Consumer Price Index
Units:
Frequency:
Suggested Citation:
U.S. Bureau of Labor Statistics, Consumer Price Index for All Urban Consumers: Services Less Energy Services in U.S. City Average [CUSR0000SASLE], retrieved from FRED, Federal Reserve Bank of St. Louis; https://fred.stlouisfed.org/series/CUSR0000SASLE, .
Release Tables
Consumer Price Index
- CPI for U.S. City Average: Monthly, Seasonally Adjusted
- CPI for U.S. City Average: Monthly, Seasonally Adjusted
Personal Income and Outlays
Related Data and Content
Data Suggestions Based On Your Search


Content Suggestions


Other Formats
Median Consumer Price Index
Index Dec 1982=100, Monthly, Seasonally Adjusted Percent Change, Monthly, Seasonally Adjusted Percent Change from Year Ago, Monthly, Seasonally AdjustedConsumer Price Index for All Urban Consumers: All Items in U.S. City Average
Monthly, Not Seasonally Adjusted Semiannual, Not Seasonally AdjustedConsumer Price Index for All Urban Consumers: All Items Less Food and Energy in U.S. City Average
Monthly, Not Seasonally Adjusted Semiannual, Not Seasonally AdjustedPersonal Consumption Expenditures: Chain-type Price Index
Annual, Not Seasonally Adjusted Quarterly, Seasonally AdjustedPersonal Consumption Expenditures Excluding Food and Energy (Chain-Type Price Index)
Percent Change from Quarter One Year Ago, Quarterly, Seasonally Adjusted16% Trimmed-Mean Consumer Price Index
Index Dec 1982=100, Monthly, Seasonally Adjusted Percent Change, Monthly, Seasonally Adjusted Percent Change from Year Ago, Monthly, Seasonally AdjustedSticky Price Consumer Price Index less Food and Energy
3-Month Annualized Percent Change, Monthly, Seasonally Adjusted Percent Change, Monthly, Seasonally Adjusted Percent Change at Annual Rate, Monthly, Seasonally AdjustedConsumer Price Index for All Urban Consumers: Services Less Energy Services in U.S. City Average
Monthly, Not Seasonally Adjusted Semiannual, Not Seasonally AdjustedRelated Categories
Consumer Price Indexes (CPI and PCE)
Prices
Special Indexes
Price Indexes & Deflators
National Income & Product Accounts
National Accounts
Releases
More
Series from Current Median CPI
More
Series from Consumer Price Index
More
Series from Personal Income and Outlays
More
Series from Sticky Price CPI
Tags
Cleveland Fed
Median
Consumer Price Index
Rate
Price Index
Indexes
Price
Seasonally Adjusted
Copyrighted: Citation Required
Monthly
Nation
United States of America
Headline Figure
Average
All Items
Urban
Consumer
Inflation
Bureau of Labor Statistics
Public Domain: Citation Requested
Core Inflation
Chained
Personal Consumption Expenditures
Consumption Expenditures
Consumption
Personal
National Income and Product Accounts
Bureau of Economic Analysis
Energy
Trimmed Mean
Sticky
Atlanta Fed
Services