FRED Graph

Your trusted data source
since 1991.
Source: Board of Governors of the Federal Reserve System (US)
Release: H.6 Money Stock Measures
Units:
Frequency:
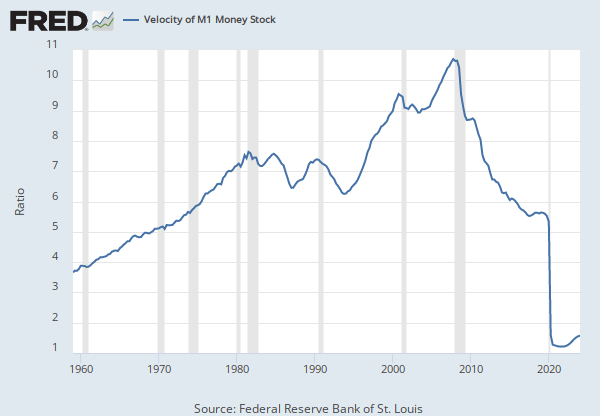
This weekly series is discontinued and will no longer be updated. The non-seasonally adjusted version of this weekly series is WM2NS, and the seasonally adjusted monthly series is M2SL.
Starting on February 23, 2021, the H.6 statistical release is now published at a monthly frequency and contains only monthly average data needed to construct the monetary aggregates. Weekly average, non-seasonally adjusted data will continue to be made available, while weekly average, seasonally adjusted data will no longer be provided. For further information about the changes to the H.6 Statistical Release, see the announcements provided by the source.
Before May 2020, M2 consists of M1 plus (1) savings deposits (including money market deposit accounts); (2) small-denomination time deposits (time deposits in amounts of less than $100,000) less individual retirement account (IRA) and Keogh balances at depository institutions; and (3) balances in retail money market funds (MMFs) less IRA and Keogh balances at MMFs.
Beginning May 2020, M2 consists of M1 plus (1) small-denomination time deposits (time deposits in amounts of less than $100,000) less IRA and Keogh balances at depository institutions; and (2) balances in retail MMFs less IRA and Keogh balances at MMFs. Seasonally adjusted M2 is constructed by summing savings deposits (before May 2020), small-denomination time deposits, and retail MMFs, each seasonally adjusted separately, and adding this result to seasonally adjusted M1. For more information on the H.6 release changes and the regulatory amendment that led to the creation of the other liquid deposits component and its inclusion in the M1 monetary aggregate, see the H.6 announcements and Technical Q&As posted on December 17, 2020.
Board of Governors of the Federal Reserve System (US), M2 (DISCONTINUED) [M2], retrieved from FRED, Federal Reserve Bank of St. Louis; https://fred.stlouisfed.org/series/M2, May 7, 2024.
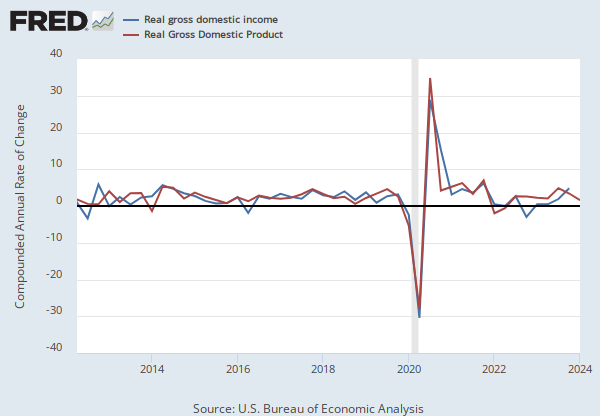
Source: U.S. Bureau of Economic Analysis
Release: Gross Domestic Product
Units:
Frequency:
BEA Account Code: A191RX
Real gross domestic product is the inflation adjusted value of the goods and services produced by labor and property located in the United States.For more information see the Guide to the National Income and Product Accounts of the United States (NIPA). For more information, please visit the Bureau of Economic Analysis.
U.S. Bureau of Economic Analysis, Real Gross Domestic Product [GDPC1], retrieved from FRED, Federal Reserve Bank of St. Louis; https://fred.stlouisfed.org/series/GDPC1, May 7, 2024.
Source: Wilshire Associates
Release: Wilshire Indexes
Units:
Frequency:
The observations for the Wilshire 5000 Total Market Index represent the daily index value at market close. The market typically closes at 4 PM ET, except for holidays when it sometimes closes early.
The total market indexes are total market returns, which do include reinvested dividends. Copyright, 2016, Wilshire Associates Incorporated. Reprinted with permission. For more information about the various indexes, visit Wilshire Associates.
Wilshire Associates, Wilshire 5000 Total Market Index [WILL5000IND], retrieved from FRED, Federal Reserve Bank of St. Louis; https://fred.stlouisfed.org/series/WILL5000IND, May 7, 2024.