Notes
Source: Board of Governors of the Federal Reserve System (US)
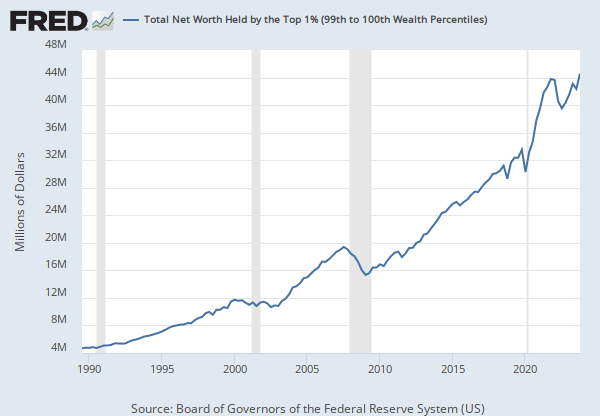
Release: Distributional Financial Accounts
Units:
Frequency:
Notes:
The Distributional Financial Accounts (DFAs) integrate two data products produced by the Federal Reserve Board: the Financial Accounts of the United States, which provide quarterly data on aggregate balance sheets of major sectors of the U.S. economy, and the Survey of Consumer Finances (SCF), which provides comprehensive triennial microdata on the assets and liabilities of a representative sample of U.S. households.
Information on the data collection process can be found at the Board of Governors."
Suggested Citation:
Board of Governors of the Federal Reserve System (US), Net Worth Held by the Bottom 50% (1st to 50th Wealth Percentiles) [WFRBLB50107], retrieved from FRED, Federal Reserve Bank of St. Louis; https://fred.stlouisfed.org/series/WFRBLB50107, .
Source: U.S. Bureau of Labor Statistics
Release: Employment Situation
Units:
Frequency:
Notes:
Production and related employees include working supervisors and all nonsupervisory employees (including group leaders and trainees) engaged in fabricating, processing, assembling, inspecting, receiving, storing, handling, packing, warehousing, shipping, trucking, hauling, maintenance, repair, janitorial, guard services, product development, auxiliary production for plant's own use (for example, power plant), recordkeeping, and other services closely associated with the above production operations.
#Nonsupervisory employees include those individuals in private, service-providing industries who are not above the working-supervisor level. This group includes individuals such as office and clerical workers, repairers, salespersons, operators, drivers, physicians, lawyers, accountants, nurses, social workers, research aides, teachers, drafters, photographers, beauticians, musicians, restaurant workers, custodial workers, attendants, line installers and repairers, laborers, janitors, guards, and other employees at similar occupational levels whose services are closely associated with those of the employees listed.
The series comes from the 'Current Employment Statistics (Establishment Survey).'
The source code is: CES0500000008
Suggested Citation:
U.S. Bureau of Labor Statistics, Average Hourly Earnings of Production and Nonsupervisory Employees, Total Private [AHETPI], retrieved from FRED, Federal Reserve Bank of St. Louis; https://fred.stlouisfed.org/series/AHETPI, .
Source: U.S. Bureau of Labor Statistics
Release: Consumer Price Index
Units:
Frequency:
Notes:
The Consumer Price Index for All Urban Consumers: All Items (CPIAUCSL) is a price index of a basket of goods and services paid by urban consumers. Percent changes in the price index measure the inflation rate between any two time periods. The most common inflation metric is the percent change from one year ago. It can also represent the buying habits of urban consumers. This particular index includes roughly 88 percent of the total population, accounting for wage earners, clerical workers, technical workers, self-employed, short-term workers, unemployed, retirees, and those not in the labor force.
The CPIs are based on prices for food, clothing, shelter, and fuels; transportation fares; service fees (e.g., water and sewer service); and sales taxes. Prices are collected monthly from about 4,000 housing units and approximately 26,000 retail establishments across 87 urban areas. To calculate the index, price changes are averaged with weights representing their importance in the spending of the particular group. The index measures price changes (as a percent change) from a predetermined reference date. In addition to the original unadjusted index distributed, the Bureau of Labor Statistics also releases a seasonally adjusted index. The unadjusted series reflects all factors that may influence a change in prices. However, it can be very useful to look at the seasonally adjusted CPI, which removes the effects of seasonal changes, such as weather, school year, production cycles, and holidays.
The CPI can be used to recognize periods of inflation and deflation. Significant increases in the CPI within a short time frame might indicate a period of inflation, and significant decreases in CPI within a short time frame might indicate a period of deflation. However, because the CPI includes volatile food and oil prices, it might not be a reliable measure of inflationary and deflationary periods. For a more accurate detection, the core CPI (CPILFESL) is often used. When using the CPI, please note that it is not applicable to all consumers and should not be used to determine relative living costs. Additionally, the CPI is a statistical measure vulnerable to sampling error since it is based on a sample of prices and not the complete average.
For more information on the CPI, see the Handbook of Methods, the release notes and announcements, and the Frequently Asked Questions (FAQs).
Suggested Citation:
U.S. Bureau of Labor Statistics, Consumer Price Index for All Urban Consumers: All Items in U.S. City Average [CPIAUCSL], retrieved from FRED, Federal Reserve Bank of St. Louis; https://fred.stlouisfed.org/series/CPIAUCSL, .
Source: S&P Dow Jones Indices LLC
Release: Standard & Poors
Units:
Frequency:
Notes:
The observations for the S&P 500 represent the daily index value at market close. The market typically closes at 4 PM ET, except for holidays when it sometimes closes early.
The Federal Reserve Bank of St. Louis and S&P Dow Jones Indices LLC have reached a new agreement on the use of Standard & Poors and Dow Jones Averages series in FRED. FRED and its associated services will include 10 years of daily history for Standard & Poors and Dow Jones Averages series.
The S&P 500 is regarded as a gauge of the large cap U.S. equities market. The index includes 500 leading companies in leading industries of the U.S. economy, which are publicly held on either the NYSE or NASDAQ, and covers 75% of U.S. equities. Since this is a price index and not a total return index, the S&P 500 index here does not contain dividends.
Copyright © 2016, S&P Dow Jones Indices LLC. All rights reserved. Reproduction of S&P 500 in any form is prohibited except with the prior written permission of S&P Dow Jones Indices LLC ("S&P"). S&P does not guarantee the accuracy, adequacy, completeness or availability of any information and is not responsible for any errors or omissions, regardless of the cause or for the results obtained from the use of such information. S&P DISCLAIMS ANY AND ALL EXPRESS OR IMPLIED WARRANTIES, INCLUDING, BUT NOT LIMITED TO, ANY WARRANTIES OF MERCHANTABILITY OR FITNESS FOR A PARTICULAR PURPOSE OR USE. In no event shall S&P be liable for any direct, indirect, special or consequential damages, costs, expenses, legal fees, or losses (including lost income or lost profit and opportunity costs) in connection with subscriber's or others' use of S&P 500.
Permission to reproduce S&P 500 can be requested from index_services@spdji.com. More contact details are available here, including phone numbers for all regional offices.
Suggested Citation:
S&P Dow Jones Indices LLC, S&P 500 [SP500], retrieved from FRED, Federal Reserve Bank of St. Louis; https://fred.stlouisfed.org/series/SP500, .
Source: Board of Governors of the Federal Reserve System (US)
Release: Distributional Financial Accounts
Units:
Frequency:
Notes:
The Distributional Financial Accounts (DFAs) integrate two data products produced by the Federal Reserve Board: the Financial Accounts of the United States, which provide quarterly data on aggregate balance sheets of major sectors of the U.S. economy, and the Survey of Consumer Finances (SCF), which provides comprehensive triennial microdata on the assets and liabilities of a representative sample of U.S. households.
Information on the data collection process can be found at the Board of Governors."
Suggested Citation:
Board of Governors of the Federal Reserve System (US), Net Worth Held by the 50th to 90th Wealth Percentiles [WFRBLN40080], retrieved from FRED, Federal Reserve Bank of St. Louis; https://fred.stlouisfed.org/series/WFRBLN40080, .
Source: Zillow
Release: Zillow Home Value Index (ZHVI)
Units:
Frequency:
Notes:
The Zillow Home Value Index or ZHVI is a smoothed, seasonally adjusted measure of the typical home value and market changes across a given region and housing type. It reflects the typical value for homes in the 35th to 65th percentile range.
Home types captured in ZHVI include single-family residences, condos, and co-ops.
A single-family home is a standalone, detached house used as a single dwelling unit, meaning a residence for one family, person or household. It has its own private entrance and direct street access, and is built on its own land, usually with additional yard space.
An owner-occupied apartment is generally referred to as a condominium or condo. The public common areas are jointly-owned and usually managed by a homeowners association (HOA).
A cooperative, or co-op, is a type of housing that is actually a corporation. A co-op resembles a condominium but the unit owners do not own their unit outright. Each resident owns a share in a corporation that entitles them to live in one of the units under a lease agreement.
For more information on types of houses, check out Zillow's types of houses article. For information about ZHVI, check out their user guide. For more information about methodology check out this overview of ZHVI and a deep-dive into its methodology.
Suggested Citation:
Zillow, Zillow Home Value Index (ZHVI) for All Homes Including Single-Family Residences, Condos, and CO-OPs in the United States of America [USAUCSFRCONDOSMSAMID], retrieved from FRED, Federal Reserve Bank of St. Louis; https://fred.stlouisfed.org/series/USAUCSFRCONDOSMSAMID, .
Source: U.S. Bureau of Economic Analysis
Release: Gross Domestic Product
Units:
Frequency:
Notes:
BEA Account Code: A191RC
Gross domestic product (GDP), the featured measure of U.S. output, is the market value of the goods and services produced by labor and property located in the United States.For more information, see the Guide to the National Income and Product Accounts of the United States (NIPA) and the Bureau of Economic Analysis.
Suggested Citation:
U.S. Bureau of Economic Analysis, Gross Domestic Product [GDP], retrieved from FRED, Federal Reserve Bank of St. Louis; https://fred.stlouisfed.org/series/GDP, .
Release Tables
Consumer Price Index
Distributional Financial Accounts
Employment Situation
Gross Domestic Product
- Table 1.1.5. Gross Domestic Product: Quarterly
- Table 1.2.5. Gross Domestic Product by Major Type of Product: Quarterly
- Table 1.3.5. Gross Value Added by Sector: Quarterly
- Table 1.4.5. Relation of Gross Domestic Product, Gross Domestic Purchases, and Final Sales to Domestic Purchasers: Quarterly
- Table 1.5.5. Gross Domestic Product, Expanded Detail: Quarterly
- Table 1.7.5. Relation of Gross Domestic Product, Gross National Product, Net National Product, National Income, and Personal Income: Quarterly
- Table 1.17.5. Gross Domestic Product, Gross Domestic Income, and Other Major NIPA Aggregates: Quarterly
Related Data and Content
Data Suggestions Based On Your Search


Content Suggestions


Other Formats
Average Hourly Earnings of Production and Nonsupervisory Employees, Total Private
Monthly, Not Seasonally AdjustedConsumer Price Index for All Urban Consumers: All Items in U.S. City Average
Monthly, Not Seasonally Adjusted Semiannual, Not Seasonally AdjustedGross Domestic Product
Annual, Not Seasonally Adjusted Annual, Not Seasonally Adjusted Index 2017=100, Quarterly, Not Seasonally Adjusted Millions of Dollars, Quarterly, Not Seasonally Adjusted Percent Change from Preceding Period, Annual, Not Seasonally Adjusted Percent Change from Preceding Period, Quarterly, Seasonally Adjusted Annual RateRelated Categories
Income Distribution
Population, Employment, & Labor Markets
Total Private
Current Employment Statistics (Establishment Survey)
Consumer Price Indexes (CPI and PCE)
Prices
Stock Market Indexes
Financial Indicators
Money, Banking, & Finance
House Price Indexes
GDP/GNP
National Income & Product Accounts
National Accounts
Releases
More
Series from Distributional Financial Accounts
More
Series from Employment Situation
More
Series from Consumer Price Index
More
Series from Standard & Poors
More
Series from Zillow Home Value Index (ZHVI)
More
Series from Gross Domestic Product
Tags
Net Worth
Wealth
Percentile
Net
Board of Governors
Quarterly
Nation
Public Domain: Citation Requested
United States of America
Not Seasonally Adjusted
Nonsupervisory
Headline Figure
Current Employment Statistics Survey (Establishment Survey)
Average
Earnings
Hours
Wages
Production
Private
Employment
Seasonally Adjusted
Bureau of Labor Statistics
Monthly
All Items
Urban
Consumer
Consumer Price Index
Inflation
Price Index
Indexes
Price
S&P
S&P Dow Jones Indices LLC
Stock Market
Copyrighted: Pre-Approval Required
Daily
Zillow
Condos
1-Unit Structures
Residential
Family
Housing
Copyrighted: Citation Required
National Income and Product Accounts
Bureau of Economic Analysis
Gross Domestic Product