Notes
Source: University of Michigan
Release: Surveys of Consumers
Units:
Frequency:
Notes:
Median expected price change next 12 months, Surveys of Consumers. The most recent value is not shown due to an agreement with the source.
This data should be cited as follows: "Surveys of Consumers, University of Michigan, University of Michigan: Inflation Expectation© [MICH], retrieved from FRED, Federal Reserve Bank of St. Louis https://fred.stlouisfed.org/series/MICH/, (Accessed on date)"
Copyright, 2016, Surveys of Consumers, University of Michigan. Reprinted with permission.
Suggested Citation:
University of Michigan, University of Michigan: Inflation Expectation [MICH], retrieved from FRED, Federal Reserve Bank of St. Louis; https://fred.stlouisfed.org/series/MICH, .
Source: Federal Reserve Bank of St. Louis
Release: Interest Rate Spreads
Units:
Frequency:
Notes:
This series is a measure of expected inflation (on average) over the five-year period that begins five years from today.
This series is constructed as:
(((((1+((BC_10YEAR-TC_10YEAR)/100))^10)/((1+((BC_5YEAR-TC_5YEAR)/100))^5))^0.2)-1)*100
where BC10_YEAR, TC_10YEAR, BC_5YEAR, and TC_5YEAR are the 10 year and 5 year nominal and inflation adjusted Treasury securities. All of those are the actual series IDs in FRED.
Starting with the update on June 21, 2019, the Treasury bond data used in calculating interest rate spreads is obtained directly from the U.S. Treasury Department.
Suggested Citation:
Federal Reserve Bank of St. Louis, 5-Year, 5-Year Forward Inflation Expectation Rate [T5YIFRM], retrieved from FRED, Federal Reserve Bank of St. Louis; https://fred.stlouisfed.org/series/T5YIFRM, .
Source: U.S. Bureau of Labor Statistics
Release: Consumer Price Index
Units:
Frequency:
Notes:
The "Consumer Price Index for All Urban Consumers: All Items Less Food & Energy" is an aggregate of prices paid by urban consumers for a typical basket of goods, excluding food and energy. This measurement, known as "Core CPI," is widely used by economists because food and energy have very volatile prices. The Bureau of Labor Statistics defines and measures the official CPI, and more information can be found in the FAQ or in this article.
Suggested Citation:
U.S. Bureau of Labor Statistics, Consumer Price Index for All Urban Consumers: All Items Less Food and Energy in U.S. City Average [CPILFESL], retrieved from FRED, Federal Reserve Bank of St. Louis; https://fred.stlouisfed.org/series/CPILFESL, .
Source: U.S. Bureau of Economic Analysis
Release: Personal Income and Outlays
Units:
Frequency:
Notes:
BEA Account Code: DPCCRG
The Personal Consumption Expenditures Price Index is a measure of the prices that people living in the United States, or those buying on their behalf, pay for goods and services. The change in the PCE price index is known for capturing inflation (or deflation) across a wide range of consumer expenses and reflecting changes in consumer behavior. For example, if car prices rise, car sales may decline while bicycle sales increase.
The PCE Price Index is produced by the Bureau of Economic Analysis (BEA), which revises previously published PCE data to reflect updated information or new methodology, providing consistency across decades of data that's valuable for researchers. They also offer the series as a Chain-Type index and excluding food and energy products, as above. The PCE price index less food excluding food and energy is used primarily for macroeconomic analysis and forecasting future values of the PCE price index.
The PCE Price Index is similar to the Bureau of Labor Statistics' consumer price index for urban consumers. The two indexes, which have their own purposes and uses, are constructed differently, resulting in different inflation rates.
For more information on the PCE price index, see:
U.S. Bureau of Economic Analysis, Guide to the National Income and Product Accounts of the United States (NIPA)
U.S. Bureau of Economic Analysis, Personal Consumption Expenditures Price Index
U.S. Bureau of Economic Analysis, Prices & Inflation
U.S. Bureau of Labor Statistics, Differences between the Consumer Price Index and the Personal Consumption Expenditure Price Index
Suggested Citation:
U.S. Bureau of Economic Analysis, Personal Consumption Expenditures Excluding Food and Energy (Chain-Type Price Index) [PCEPILFE], retrieved from FRED, Federal Reserve Bank of St. Louis; https://fred.stlouisfed.org/series/PCEPILFE, .
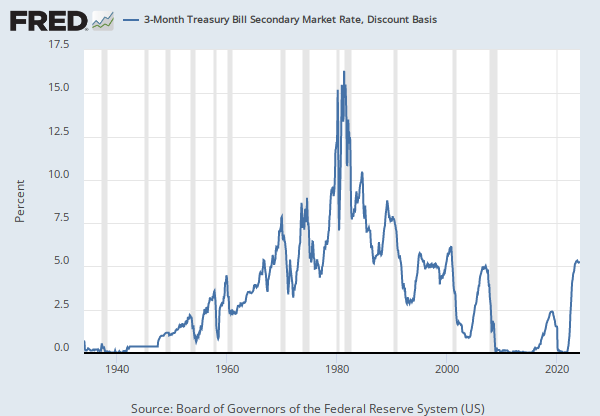
Source: Board of Governors of the Federal Reserve System (US)
Release: H.15 Selected Interest Rates
Units:
Frequency:
Notes:
Averages of business days. For further information regarding treasury constant maturity data, please refer to the H.15 Statistical Release notes and the Treasury Yield Curve Methodology.
For questions on the data, please contact the data source. For questions on FRED functionality, please contact us here.
Suggested Citation:
Board of Governors of the Federal Reserve System (US), Market Yield on U.S. Treasury Securities at 10-Year Constant Maturity, Quoted on an Investment Basis [GS10], retrieved from FRED, Federal Reserve Bank of St. Louis; https://fred.stlouisfed.org/series/GS10, .
Release Tables
Consumer Price Index
H.15 Selected Interest Rates
Personal Income and Outlays
Related Data and Content
Data Suggestions Based On Your Search


Content Suggestions


Other Formats
5-Year, 5-Year Forward Inflation Expectation Rate
Daily, Not Seasonally AdjustedConsumer Price Index for All Urban Consumers: All Items Less Food and Energy in U.S. City Average
Monthly, Not Seasonally Adjusted Semiannual, Not Seasonally AdjustedPersonal Consumption Expenditures Excluding Food and Energy (Chain-Type Price Index)
Percent Change from Quarter One Year Ago, Quarterly, Seasonally AdjustedMarket Yield on U.S. Treasury Securities at 10-Year Constant Maturity, Quoted on an Investment Basis
Annual, Not Seasonally Adjusted Daily, Not Seasonally Adjusted Weekly, Not Seasonally AdjustedRelated Categories
Prices
Interest Rate Spreads
Interest Rates
Money, Banking, & Finance
Special Indexes
Consumer Price Indexes (CPI and PCE)
Price Indexes & Deflators
National Income & Product Accounts
National Accounts
Treasury Constant Maturity
Releases
More
Series from Surveys of Consumers
More
Series from Interest Rate Spreads
More
Series from Consumer Price Index
More
Series from Personal Income and Outlays
More
Series from H.15 Selected Interest Rates
Tags
Univ. of Michigan
Consumer Sentiment
Projection
Michigan
Consumer
Inflation
Copyrighted: Citation Required
Monthly
Nation
United States of America
Not Seasonally Adjusted
Spread
5-Year
Interest Rate
Interest
St. Louis Fed
Rate
Core Inflation
Headline Figure
All Items
Urban
Consumer Price Index
Price Index
Indexes
Seasonally Adjusted
Price
Bureau of Labor Statistics
Public Domain: Citation Requested
Chained
Energy
Personal Consumption Expenditures
Consumption Expenditures
Consumption
Personal
National Income and Product Accounts
Bureau of Economic Analysis
10-Year
Maturity
H.15 Selected Interest Rates
Treasury
Board of Governors