Notes
Source: S&P Dow Jones Indices LLC
Release: S&P Cotality Case-Shiller Home Price Indices
Units:
Frequency:
Notes:
For more information regarding the index, please visit Standard & Poor's. There is more information about home price sales pairs in the Methodology section. Copyright, 2016, Standard & Poor's Financial Services LLC. Reprinted with permission.
Suggested Citation:
S&P Dow Jones Indices LLC, S&P Cotality Case-Shiller U.S. National Home Price Index [CSUSHPINSA], retrieved from FRED, Federal Reserve Bank of St. Louis; https://fred.stlouisfed.org/series/CSUSHPINSA, .
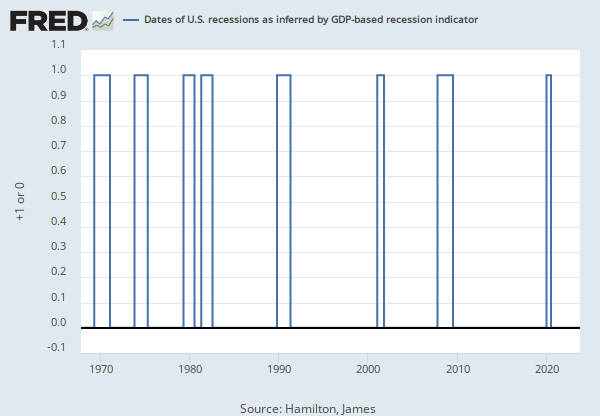
Source: Sahm, Claudia
Release: Sahm Rule Recession Indicator
Units:
Frequency:
Notes:
Sahm Recession Indicator signals the start of a recession when the three-month moving average of the national unemployment rate (U3) rises by 0.50 percentage points or more relative to the minimum of the three-month averages from the previous 12 months.
This indicator is based on "real-time" data, that is, the unemployment rate (and the recent history of unemployment rates) that were available in a given month. The BLS revises the unemployment rate each year at the beginning of January, when the December unemployment rate for the prior year is published. Revisions to the seasonal factors can affect estimates in recent years. Otherwise the unemployment rate does not revise.
Suggested Citation:
Sahm, Claudia, Real-time Sahm Rule Recession Indicator [SAHMREALTIME], retrieved from FRED, Federal Reserve Bank of St. Louis; https://fred.stlouisfed.org/series/SAHMREALTIME, .
Release Tables
S&P Cotality Case-Shiller Home Price Indices
Related Data and Content
Data Suggestions Based On Your Search


Content Suggestions


Other Formats
Related Categories
Releases
More
Series from S&P Cotality Case-Shiller Home Price Indices
More
Series from Sahm Rule Recession Indicator
Tags
S&P Cotality Case-Shiller Home Price Indices
S&P Dow Jones Indices LLC
House Price Index
Copyrighted: Pre-Approval Required
Housing
Price Index
Indexes
Price
Monthly
Nation
United States of America
Not Seasonally Adjusted
Claudia Sahm
Recession Indicators
Academic Data
Seasonally Adjusted
Public Domain: Citation Requested