Notes
Source: Federal Reserve Bank of Philadelphia
Release: State Coincident Indexes
Units:
Frequency:
Notes:
The Coincident Economic Activity Index includes four indicators: nonfarm payroll employment, the unemployment rate, average hours worked in manufacturing and wages and salaries. The trend for each state's index is set to match the trend for gross state product.
Suggested Citation:
Federal Reserve Bank of Philadelphia, Coincident Economic Activity Index for the United States [USPHCI], retrieved from FRED, Federal Reserve Bank of St. Louis; https://fred.stlouisfed.org/series/USPHCI, .
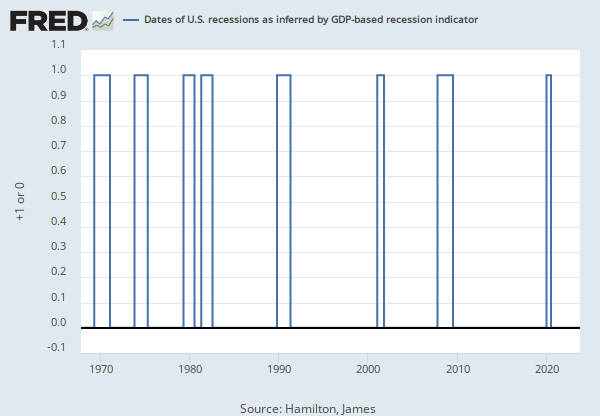
Source: Hamilton, James
Release: GDP-Based Recession Indicator Index
Units:
Frequency:
Notes:
This index measures the probability that the U.S. economy was in a recession during the indicated quarter. It is based on a mathematical description of the way that recessions differ from expansions. The index corresponds to the probability (measured in percent) that the underlying true economic regime is one of recession based on the available data. Whereas the NBER business cycle dates are based on a subjective assessment of a variety of indicators that may not be released until several years after the event, this index is entirely mechanical, is based solely on currently available GDP data and is reported every quarter. Due to the possibility of data revisions and the challenges in accurately identifying the business cycle phase, the index is calculated for the quarter just preceding the most recently available GDP numbers. Once the index is calculated for that quarter, it is never subsequently revised. The value at every date was inferred using only data that were available one quarter after that date and as those data were reported at the time.
If the value of the index rises above 67% that is a historically reliable indicator that the economy has entered a recession. Once this threshold has been passed, if it falls below 33% that is a reliable indicator that the recession is over.
For more information about this series visit http://econbrowser.com/recession-index.
Suggested Citation:
Hamilton, James, GDP-Based Recession Indicator Index [JHGDPBRINDX], retrieved from FRED, Federal Reserve Bank of St. Louis; https://fred.stlouisfed.org/series/JHGDPBRINDX, .
Source: Organization for Economic Co-operation and Development
Release: Main Economic Indicators
Units:
Frequency:
Notes:
OECD Data Filters:
REF_AREA: USA
MEASURE: LI
UNIT_MEASURE: IX
ACTIVITY: _Z
ADJUSTMENT: NOR
TRANSFORMATION: IX
TIME_HORIZ: _Z
METHODOLOGY: H
FREQ: M
All OECD data should be cited as follows: OECD (year), (dataset name), (data source) DOI or https://data-explorer.oecd.org/. (accessed on (date)).
Suggested Citation:
Organization for Economic Co-operation and Development, Composite Leading Indicators: Composite Leading Indicator (CLI) Normalized for United States [USALOLITONOSTSAM], retrieved from FRED, Federal Reserve Bank of St. Louis; https://fred.stlouisfed.org/series/USALOLITONOSTSAM, .
Release Tables
Main Economic Indicators
State Coincident Indexes
Related Data and Content
Data Suggestions Based On Your Search


Content Suggestions


Related Categories
Business Cycle Expansions & Contractions
Production & Business Activity
Recession Probabilities
Academic Data
United States
Countries
International Data
Releases
More
Series from State Coincident Indexes
More
Series from GDP-Based Recession Indicator Index
More
Series from Main Economic Indicators
Tags
Coincident Economic Activity
Philadelphia Fed
Indexes
Seasonally Adjusted
Copyrighted: Citation Required
Monthly
Nation
United States of America
Hamilton, James
Recession Indicators
Percent
Gross Domestic Product
Quarterly
Public Domain: Citation Requested
Not Seasonally Adjusted
Leading Indicator
Org. for Economic Co-operation and Development