How Does FRED Add New Data?
What Does FRED Do To Ensure It Publishes Data Accurately?
How Does FRED Update Its Database?
How Can I Navigate to the Originating Source of the Data?
How to Find More Information About the Data?
What is the Date Format?
What Formulas are Used to Calculate Growth Rates?
What Dates Are Used for the U.S. Recession Bars?
What is Frequency Aggregation?
How are Missing Values Determined for First/Last Observations?
How are Missing Values Treated in Average, Sum, and End of Period Aggregation Methods?
How are Data Aggregated When Periods Overlap?
How is the Number of Decimal Places Determined for Aggregated Values?
What is the Order of Processing in FRED Graph?
Change the Time Range
Edit a Data Series: Units
Format the Graph and Line Settings
Edit a Data Series: Frequency
Edit a Data Series: Frequency Aggregation
Add a Data Series to Graph
Remove a Data Series from Graph
Customize Data, Add Series to Existing Line
Add User Defined Straight Line to a FRED Graph
How Does FRED Add New Data?
What Does FRED Do To Ensure It Publishes Data Accurately?
How Does FRED Update Its Database?
Save Your Graphs
FRED in Action Videos
Contact Us
Sharing Options
Embedding FRED Graphs on Your Website or Blog
What is the Date Format?
What Formulas are Used to Calculate Growth Rates?
What Dates Are Used for the U.S. Recession Bars?
Add a Data Series to Graph
Cite the Data
Customize Data, Add Series to Existing Line
Edit the Data Grouped By
How Does FRED Add New Data?
What Does FRED Do To Ensure It Publishes Data Accurately?
How Does FRED Update Its Database?
How Can I Navigate to the Originating Source of the Data?
How to Find More Information About the Data?
What is the Date Format?
What Formulas are Used to Calculate Growth Rates?
What Dates Are Used for the U.S. Recession Bars?
What is Frequency Aggregation?
How are Missing Values Determined for First/Last Observations?
How are Missing Values Treated in Average, Sum, and End of Period Aggregation Methods?
How are Data Aggregated When Periods Overlap?
How is the Number of Decimal Places Determined for Aggregated Values?
What is the Order of Processing in FRED Graph?
Change the Time Range
Edit a Data Series: Units
Format the Graph and Line Settings
Edit a Data Series: Frequency
Edit a Data Series: Frequency Aggregation
Add a Data Series to Graph
Remove a Data Series from Graph
Customize Data, Add Series to Existing Line
Add User Defined Straight Line to a FRED Graph
How Does FRED Add New Data?
What Does FRED Do To Ensure It Publishes Data Accurately?
How Does FRED Update Its Database?
Save Your Graphs
FRED in Action Videos
Contact Us
Sharing Options
Embedding FRED Graphs on Your Website or Blog
What is the Date Format?
What Formulas are Used to Calculate Growth Rates?
What Dates Are Used for the U.S. Recession Bars?
Add a Data Series to Graph
Cite the Data
Customize Data, Add Series to Existing Line
Edit the Data Grouped By
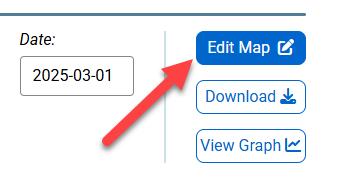
Above the map, click the "EDIT MAP" button.
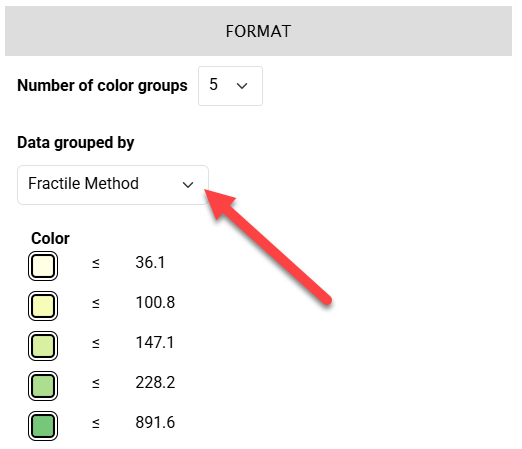
Click on the “Data grouped by” dropdown located in the FORMAT section and select one of the following options:
Fractile Method: This method divides data into intervals so that there are the same number, or nearly the same number of data points in each interval.
Equal Interval: This method divides data into equal-sized ranges or intervals.
If Fractile Method or Equal Interval are selected, the map will update automatically.
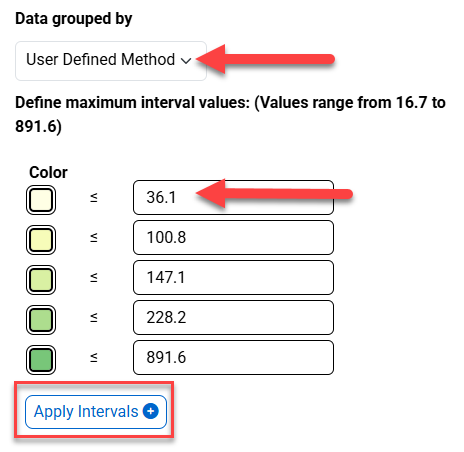
User Defined Method: This method allows the user to define the intervals. When selected, the legend value fields become editable. After updating the values, click on the “Apply Intervals” button to update the map.