Notes
Source: Board of Governors of the Federal Reserve System (US)
Release: H.8 Assets and Liabilities of Commercial Banks in the United States
Units:
Frequency:
Notes:
For questions on the data, please contact the data source. For questions on FRED functionality, please contact us here.
Suggested Citation:
Board of Governors of the Federal Reserve System (US), Cash Assets, All Commercial Banks [CASACBW027SBOG], retrieved from FRED, Federal Reserve Bank of St. Louis; https://fred.stlouisfed.org/series/CASACBW027SBOG, .
Source: Board of Governors of the Federal Reserve System (US)
Release: H.4.1 Factors Affecting Reserve Balances
Units:
Frequency:
Notes:
For questions on the data, please contact the data source. For questions on FRED functionality, please contact us here.
Suggested Citation:
Board of Governors of the Federal Reserve System (US), Assets: Central Bank Liquidity Swaps: Central Bank Liquidity Swaps: Wednesday Level [SWPT], retrieved from FRED, Federal Reserve Bank of St. Louis; https://fred.stlouisfed.org/series/SWPT, .
Source: U.S. Federal Open Market Committee
Source: Federal Reserve Bank of St. Louis
Release: Summary of Economic Projections
Units:
Frequency:
Notes:
The projections for the federal funds rate are the value of the midpoint of the projected appropriate target range for the federal funds rate or the projected appropriate target level for the federal funds rate at the end of the specified calendar year or over the longer run. Each participant's projections are based on his or her assessment of appropriate monetary policy. The range for each variable in a given year includes all participants' projections, from lowest to highest, for that variable in the given year. This series represents the median value of the range forecast established by the Federal Open Market Committee. For each period, the median is the middle projection when the projections are arranged from lowest to highest. When the number of projections is even, the median is the average of the two middle projections.
Digitized originals of this release can be found at https://fraser.stlouisfed.org/publication/?pid=677.
Suggested Citation:
U.S. Federal Open Market Committee and Federal Reserve Bank of St. Louis, FOMC Summary of Economic Projections for the Fed Funds Rate, Median [FEDTARMD], retrieved from FRED, Federal Reserve Bank of St. Louis; https://fred.stlouisfed.org/series/FEDTARMD, .
Source: Nasdaq, Inc.
Release: Nasdaq Daily Index Data
Units:
Frequency:
Notes:
The observations for the NASDAQ Composite Index represent the daily index value at market close. The market typically closes at 4 PM ET, except for holidays when it sometimes closes early.
The NASDAQ Composite Index is a market capitalization weighted index with more than 3000 common equities listed on the NASDAQ Stock Market. The types of securities in the index include American depositary receipts (ADRs), common stocks, real estate investment trusts (REITs), and tracking stocks. The index includes all NASDAQ listed stocks that are not derivatives, preferred shares, funds, exchange-traded funds (ETFs) or debentures.
Copyright © 2016, NASDAQ OMX Group, Inc.
Suggested Citation:
Nasdaq, Inc., NASDAQ Composite [NASDAQCOM], retrieved from FRED, Federal Reserve Bank of St. Louis; https://fred.stlouisfed.org/series/NASDAQCOM, .
Source: Federal Reserve Bank of St. Louis
Release: Interest Rate Spreads
Units:
Frequency:
Notes:
Series is calculated as the spread between 10-Year Treasury Constant Maturity (BC_10YEAR) and 3-Month Treasury Constant Maturity (BC_3MONTH).
Starting with the update on June 21, 2019, the Treasury bond data used in calculating interest rate spreads is obtained directly from the U.S. Treasury Department.
Suggested Citation:
Federal Reserve Bank of St. Louis, 10-Year Treasury Constant Maturity Minus 3-Month Treasury Constant Maturity [T10Y3M], retrieved from FRED, Federal Reserve Bank of St. Louis; https://fred.stlouisfed.org/series/T10Y3M, .
Source: Board of Governors of the Federal Reserve System (US)
Release: H.4.1 Factors Affecting Reserve Balances (data not included in press release)
Units:
Frequency:
Notes:
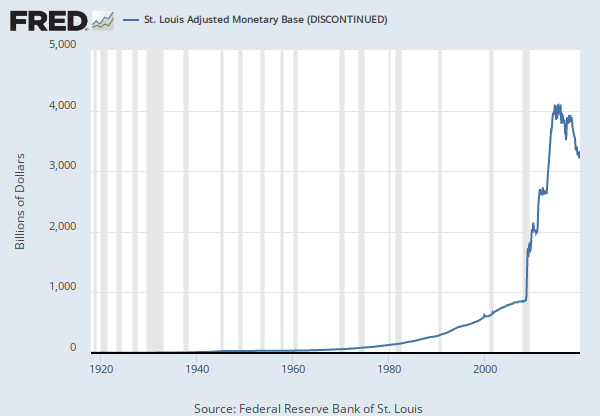
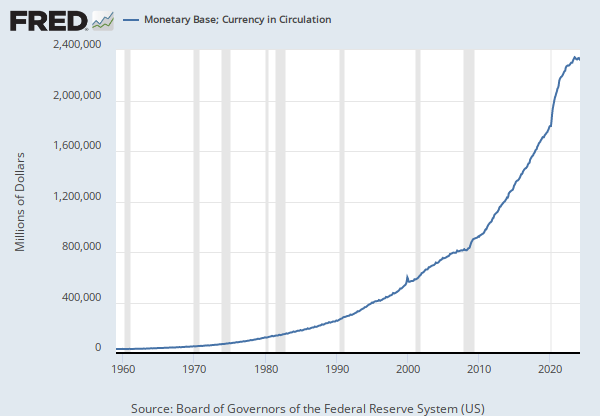
This series has been discontinued and will no longer be updated. The weekly version of this monthly series is WCURCIR.####
Suggested Citation:
Board of Governors of the Federal Reserve System (US), Currency in Circulation (DISCONTINUED) [CURRCIR], retrieved from FRED, Federal Reserve Bank of St. Louis; https://fred.stlouisfed.org/series/CURRCIR, .
Source: U.S. Bureau of Labor Statistics
Release: Consumer Price Index
Units:
Frequency:
Notes:
The Consumer Price Index for All Urban Consumers: All Items (CPIAUCSL) is a price index of a basket of goods and services paid by urban consumers. Percent changes in the price index measure the inflation rate between any two time periods. The most common inflation metric is the percent change from one year ago. It can also represent the buying habits of urban consumers. This particular index includes roughly 88 percent of the total population, accounting for wage earners, clerical workers, technical workers, self-employed, short-term workers, unemployed, retirees, and those not in the labor force.
The CPIs are based on prices for food, clothing, shelter, and fuels; transportation fares; service fees (e.g., water and sewer service); and sales taxes. Prices are collected monthly from about 4,000 housing units and approximately 26,000 retail establishments across 87 urban areas. To calculate the index, price changes are averaged with weights representing their importance in the spending of the particular group. The index measures price changes (as a percent change) from a predetermined reference date. In addition to the original unadjusted index distributed, the Bureau of Labor Statistics also releases a seasonally adjusted index. The unadjusted series reflects all factors that may influence a change in prices. However, it can be very useful to look at the seasonally adjusted CPI, which removes the effects of seasonal changes, such as weather, school year, production cycles, and holidays.
The CPI can be used to recognize periods of inflation and deflation. Significant increases in the CPI within a short time frame might indicate a period of inflation, and significant decreases in CPI within a short time frame might indicate a period of deflation. However, because the CPI includes volatile food and oil prices, it might not be a reliable measure of inflationary and deflationary periods. For a more accurate detection, the core CPI (CPILFESL) is often used. When using the CPI, please note that it is not applicable to all consumers and should not be used to determine relative living costs. Additionally, the CPI is a statistical measure vulnerable to sampling error since it is based on a sample of prices and not the complete average.
For more information on the CPI, see the Handbook of Methods, the release notes and announcements, and the Frequently Asked Questions (FAQs).
Suggested Citation:
U.S. Bureau of Labor Statistics, Consumer Price Index for All Urban Consumers: All Items in U.S. City Average [CPIAUCSL], retrieved from FRED, Federal Reserve Bank of St. Louis; https://fred.stlouisfed.org/series/CPIAUCSL, .
Source: U.S. Bureau of Economic Analysis
Release: Supplemental Estimates, Motor Vehicles
Units:
Frequency:
Notes:
Heavy trucks are trucks with more than 14,000 pounds gross vehicle weight.
Suggested Citation:
U.S. Bureau of Economic Analysis, Motor Vehicle Retail Sales: Heavy Weight Trucks [HTRUCKSSAAR], retrieved from FRED, Federal Reserve Bank of St. Louis; https://fred.stlouisfed.org/series/HTRUCKSSAAR, .
Source: U.S. Bureau of Labor Statistics
Release: Employment Situation
Units:
Frequency:
Notes:
The series comes from the 'Current Employment Statistics (Establishment Survey).'
The source code is: CES0500000003
The Average Hourly Earnings of All Private Employees is a measure of the average hourly earnings of all private employees on a “gross” basis, including premium pay for overtime and late-shift work. These differ from wage rates in that average hourly earnings measure the actual return to a worker for a set period of time, rather than the amount contracted for a unit of work, the wage rate. This measure excludes benefits, irregular bonuses, retroactive pay, and payroll taxes paid by the employer.
Average Hourly Earnings are collected in the Current Employment Statistics (CES) program and published by the BLS. It is provided on a monthly basis, so this data is used in part by macroeconomists as an initial economic indicator of current trends. Progressions in earnings specifically help policy makers understand some of the pressures driving inflation.
It is important to note that this series measures the average hourly earnings of the pool of workers in each period. Thus, changes in average hourly earnings can be due to either changes in the set of workers observed in a given period, or due to changes in earnings. For instance, in recessions that lead to the disproportionate increase of unemployment in lower-wage jobs, average hourly earnings can increase due to changes in the pool of workers rather than due to the widespread increase of hourly earnings at the worker-level.
For more information, see:
U.S. Bureau of Labor Statistics, CES Overview
U.S. Bureau of Labor Statistics, BLS Handbook of Methods: Chapter 2. Employment, Hours, and Earnings from the Establishment Survey
Suggested Citation:
U.S. Bureau of Labor Statistics, Average Hourly Earnings of All Employees, Total Private [CES0500000003], retrieved from FRED, Federal Reserve Bank of St. Louis; https://fred.stlouisfed.org/series/CES0500000003, .
Release Tables
Consumer Price Index
Employment Situation
H.4.1 Factors Affecting Reserve Balances
- Table 1. Factors Affecting Reserve Balances of Depository Institutions: Wednesday Level
- Table 2. Maturity Distribution of Securities, Loans, and Selected Other Assets and Liabilities
- Table 5. Consolidated Statement of Condition of All Federal Reserve Banks
- Table 6. Statement of Condition of Each Federal Reserve Bank
H.8 Assets and Liabilities of Commercial Banks in the United States
Summary of Economic Projections
Supplemental Estimates, Motor Vehicles
Related Data and Content
Data Suggestions Based On Your Search


Content Suggestions


Other Formats
Cash Assets, All Commercial Banks
Monthly, Not Seasonally Adjusted Monthly, Seasonally Adjusted Weekly, Not Seasonally Adjusted Percent Change at Annual Rate, Annual, Seasonally Adjusted Percent Change at Annual Rate, Monthly, Seasonally Adjusted Percent Change at Annual Rate, Quarterly, Seasonally Adjusted10-Year Treasury Constant Maturity Minus 3-Month Treasury Constant Maturity
Monthly, Not Seasonally AdjustedConsumer Price Index for All Urban Consumers: All Items in U.S. City Average
Monthly, Not Seasonally Adjusted Semiannual, Not Seasonally AdjustedMotor Vehicle Retail Sales: Heavy Weight Trucks
Thousands of Units, Monthly, Not Seasonally Adjusted Thousands of Units, Monthly, Seasonally AdjustedAverage Hourly Earnings of All Employees, Total Private
Monthly, Not Seasonally AdjustedRelated Categories
All Commercial Banks
Commercial Banking
Banking
Money, Banking, & Finance
Securities, Loans, & Other Assets & Liabilities Held by Fed
Monetary Data
FRB Rates - discount, fed funds, primary credit
Interest Rates
Stock Market Indexes
Financial Indicators
Interest Rate Spreads
Factors Affecting Reserve Balances
Consumer Price Indexes (CPI and PCE)
Prices
Motor Vehicles
Transportation
Production & Business Activity
Total Private
Current Employment Statistics (Establishment Survey)
Population, Employment, & Labor Markets
Releases
More
Series from H.8 Assets and Liabilities of Commercial Banks in the United States
More
Series from H.4.1 Factors Affecting Reserve Balances
More
Series from Summary of Economic Projections
More
Series from Nasdaq Daily Index Data
More
Series from Interest Rate Spreads
More
Series from H.4.1 Factors Affecting Reserve Balances (data not included in press release)
More
Series from Consumer Price Index
More
Series from Supplemental Estimates, Motor Vehicles
More
Series from Employment Situation
Tags
Cash
H.8 Assets & Liabilities of US Commercial Banks
Weekly
Assets
Banks
Depository Institutions
Board of Governors
Seasonally Adjusted
Nation
Public Domain: Citation Requested
United States of America
Swaps
Liquidity
H.4.1 Factors Affecting Reserve Balances
Maturity
Not Seasonally Adjusted
Federal Open Market Committee
Federal Open Markets Committee
Projection
Federal
Median
St. Louis Fed
Rate
Annual
Composite
National Association of Securities Dealers Automated Quotations
Nasdaq, Inc.
Stock Market
Copyrighted: Pre-Approval Required
Daily
Indexes
Copyrighted: Citation Required
Yield Curve
Spread
3-Month
10-Year
Treasury
Interest Rate
Interest
Currency
Discontinued
Monthly
Headline Figure
Average
All Items
Urban
Consumer
Consumer Price Index
Inflation
Price Index
Price
Bureau of Labor Statistics
Heavy Weight
Trucks
Vehicles
Retail Trade
New
Sales
Retail
Bureau of Economic Analysis
Current Employment Statistics Survey (Establishment Survey)
Earnings
Hours
Wages
Private
Employment