Notes
Source: Automatic Data Processing, Inc.
Release: ADP National Employment Report
Units:
Frequency:
Notes:
The current year’s January report reflects the scheduled annual revision of the ADP National Employment Report (NER). The data series has been reweighted to match annual Quarterly Census of Employment and Wages (QCEW) benchmark data through March of the previous year. This is a recurring process that happens every year in February and is a common practice for reports of this nature. More information about this report can be found at ADP National Employment Report website.
Suggested Citation:
Automatic Data Processing, Inc., Total Nonfarm Private Payroll Employment [ADPWNUSNERSA], retrieved from FRED, Federal Reserve Bank of St. Louis; https://fred.stlouisfed.org/series/ADPWNUSNERSA, .
Source: U.S. Bureau of Labor Statistics
Release: Employment Situation
Units:
Frequency:
Notes:
The civilian noninstitutional population is defined as: persons 16 years of age and older residing in the 50 states and the District of Columbia, who are not inmates of institutions (e.g., penal and mental facilities, homes for the aged), and who are not on active duty in the Armed Forces.
The series comes from the 'Current Population Survey (Household Survey)'
The source code is: LNS12000000
Suggested Citation:
U.S. Bureau of Labor Statistics, Employment Level [CE16OV], retrieved from FRED, Federal Reserve Bank of St. Louis; https://fred.stlouisfed.org/series/CE16OV, .
Source: U.S. Bureau of Economic Analysis
Release: Personal Income and Outlays
Units:
Frequency:
Notes:
BEA Account Code: W875RX
A Guide to the National Income and Product Accounts of the United States (NIPA) - (http://www.bea.gov/national/pdf/nipaguid.pdf)
Suggested Citation:
U.S. Bureau of Economic Analysis, Real personal income excluding current transfer receipts [W875RX1], retrieved from FRED, Federal Reserve Bank of St. Louis; https://fred.stlouisfed.org/series/W875RX1, .
Source: U.S. Bureau of Economic Analysis
Release: Personal Income and Outlays
Units:
Frequency:
Notes:
BEA Account Code: DPCERX
A Guide to the National Income and Product Accounts of the United States (NIPA)
Suggested Citation:
U.S. Bureau of Economic Analysis, Real Personal Consumption Expenditures [PCEC96], retrieved from FRED, Federal Reserve Bank of St. Louis; https://fred.stlouisfed.org/series/PCEC96, .
Source: Federal Reserve Bank of St. Louis
Release: Supplemental Estimates, Underlying Detail Tables, Spliced Series
Units:
Frequency:
Notes:
Real Manufacturing and Trade Industries Sales (CMRMTSPL) was first constructed by the Federal Reserve Bank of St. Louis in June 2013. It is calculated using Real Manufacturing and Trade Industries Sales (HMRMT) (https://fred.stlouisfed.org/series/HMRMT) and Real Manufacturing and Trade Industries (CMRMT) (https://fred.stlouisfed.org/series/CMRMT).
Before January 1997
lag1(HMRMT) = one observation earlier than current time period observation
HMRMT_PC = the growth rate of HMRMT
lead1(CMRMTSPL) = one observation later than current time period observation
HMRMT_PC = [HMRMT/lag1(HMRMT) –1]
CMRMTSPL= lead1(CMRMTSPL)/(1+HMRMT_PC)
After December 1996
CMRMTSPL= CMRMT
Suggested Citation:
Federal Reserve Bank of St. Louis, Real Manufacturing and Trade Industries Sales [CMRMTSPL], retrieved from FRED, Federal Reserve Bank of St. Louis; https://fred.stlouisfed.org/series/CMRMTSPL, .
Source: Board of Governors of the Federal Reserve System (US)
Release: G.17 Industrial Production and Capacity Utilization
Units:
Frequency:
Notes:
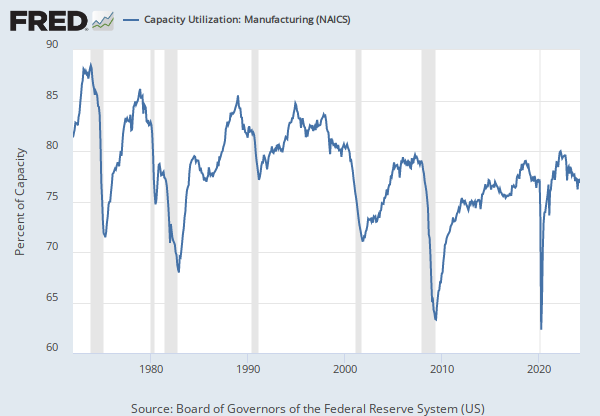
The Federal Reserve's monthly index of industrial production and the related capacity indexes and capacity utilization rates cover manufacturing, mining, and electric and gas utilities. The industrial sector, together with construction, accounts for the bulk of the variation in national output over the course of the business cycle. The industrial detail provided by these measures helps illuminate structural developments in the economy. The industrial production (IP) index measures the real output of all relevant establishments located in the United States, regardless of their ownership, but not those located in U.S. territories. For more information, see the explanatory notes issued by the Board of Governors. For recent updates, see the announcements issued by the Board of Governors.
Suggested Citation:
Board of Governors of the Federal Reserve System (US), Industrial Production: Manufacturing (NAICS) [IPMAN], retrieved from FRED, Federal Reserve Bank of St. Louis; https://fred.stlouisfed.org/series/IPMAN, .
Release Tables
ADP National Employment Report
Employment Situation
Employment Situation
- Monthly, Seasonally Adjusted (population data is not adjusted for seasonal variation; not seasonally adjusted version used)
- Table A-9. Selected employment indicators: Monthly, Seasonally Adjusted
G.17 Industrial Production and Capacity Utilization
Personal Income and Outlays
Related Data and Content
Data Suggestions Based On Your Search




Content Suggestions





Other Formats
Total Nonfarm Private Payroll Employment
Monthly, Not Seasonally Adjusted Monthly, Seasonally Adjusted Weekly, Not Seasonally AdjustedEmployment Level
Monthly, Not Seasonally AdjustedReal personal income excluding current transfer receipts
Annual, Not Seasonally Adjusted Quarterly, Seasonally Adjusted Annual RateReal Personal Consumption Expenditures
Annual, Not Seasonally Adjusted Quarterly, Not Seasonally Adjusted Quarterly, Seasonally Adjusted Annual Rate Index 2017=100, Quarterly, Not Seasonally Adjusted Percent Change from Preceding Period, Annual, Not Seasonally Adjusted Percent Change from Preceding Period, Monthly, Seasonally Adjusted Percent Change from Preceding Period, Quarterly, Seasonally Adjusted Annual Rate Percent Change from Quarter One Year Ago, Quarterly, Not Seasonally Adjusted Percent Change from Quarter One Year Ago, Quarterly, Seasonally AdjustedReal Manufacturing and Trade Industries Sales
Millions of Chained 1996 Dollars, Monthly, Seasonally Adjusted Millions of Chained 1996 Dollars, Quarterly, Seasonally Adjusted Monthly, Seasonally Adjusted Quarterly, Seasonally Adjusted Quarterly, Seasonally AdjustedIndustrial Production: Manufacturing (NAICS)
Annual, Not Seasonally Adjusted Monthly, Not Seasonally Adjusted Quarterly, Not Seasonally Adjusted Quarterly, Seasonally AdjustedRelated Categories
ADP Employment
Population, Employment, & Labor Markets
Employment
Current Population Survey (Household Survey)
Personal Income & Outlays
National Income & Product Accounts
National Accounts
Retail Trade
Production & Business Activity
Industrial Production & Capacity Utilization
Releases
More
Series from ADP National Employment Report
More
Series from Employment Situation
More
Series from Personal Income and Outlays
More
Series from Supplemental Estimates, Underlying Detail Tables, Spliced Series
More
Series from G.17 Industrial Production and Capacity Utilization
Tags
Automatic Data Processing, Inc.
Payrolls
Nonfarm
Weekly
Private
Employment
Seasonally Adjusted
Copyrighted: Citation Required
Nation
United States of America
Civilian
16 Years +
Current Population Survey (Household Survey)
Bureau of Labor Statistics
Monthly
Public Domain: Citation Requested
Transfers
Receipts
Personal Income
Personal
Income
National Income and Product Accounts
Real
Bureau of Economic Analysis
Headline Figure
Personal Consumption Expenditures
Consumption Expenditures
Consumption
Trade
Sales
St. Louis Fed
Manufacturing
Industry
G.17 Industr. Production & Capacity Utilization
North American Industry Classification System
Industrial Production
Production
Board of Governors
Indexes