Federal Reserve Economic Data
Notes
Source: U.S. Bureau of Economic Analysis
Release: Gross Domestic Product
Units:
Frequency:
Notes:
BEA Account Code: A191RC
Gross domestic product (GDP), the featured measure of U.S. output, is the market value of the goods and services produced by labor and property located in the United States.For more information, see the Guide to the National Income and Product Accounts of the United States (NIPA) and the Bureau of Economic Analysis.
Suggested Citation:
U.S. Bureau of Economic Analysis, Gross Domestic Product [GDP], retrieved from FRED, Federal Reserve Bank of St. Louis; https://fred.stlouisfed.org/series/GDP, .
Source: Federal Reserve Bank of St. Louis
Release: Recession Indicators Series
Units:
Frequency:
Notes:
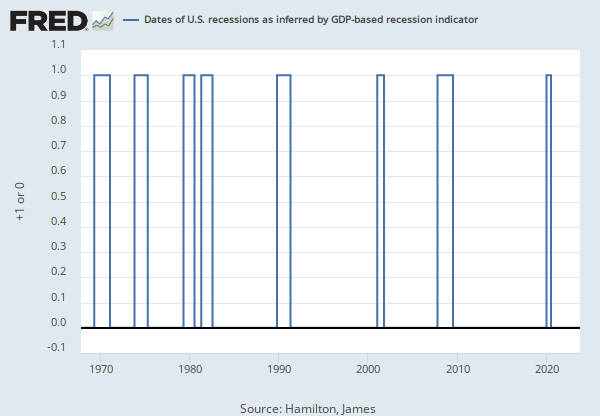
This time series is an interpretation of US Business Cycle Expansions and Contractions data provided by The National Bureau of Economic Research (NBER). Our time series is composed of dummy variables that represent periods of expansion and recession. The NBER identifies months and quarters of turning points without designating a date within the period that turning points occurred. The dummy variable adopts an arbitrary convention that the turning point occurred at a specific date within the period. The arbitrary convention does not reflect any judgment on this issue by the NBER's Business Cycle Dating Committee. A value of 1 is a recessionary period, while a value of 0 is an expansionary period. For this time series, the recession begins the first day of the period following a peak and ends on the last day of the period of the trough. For more options on recession shading, see the notes and links below.
The recession shading data that we provide initially comes from the source as a list of dates that are either an economic peak or trough. We interpret dates into recession shading data using one of three arbitrary methods. All of our recession shading data is available using all three interpretations. The period between a peak and trough is always shaded as a recession. The peak and trough are collectively extrema. Depending on the application, the extrema, both individually and collectively, may be included in the recession period in whole or in part. In situations where a portion of a period is included in the recession, the whole period is deemed to be included in the recession period.
The first interpretation, known as the midpoint method, is to show a recession from the midpoint of the peak through the midpoint of the trough for monthly and quarterly data. For daily data, the recession begins on the 15th of the month of the peak and ends on the 15th of the month of the trough. Daily data is a disaggregation of monthly data. For monthly and quarterly data, the entire peak and trough periods are included in the recession shading. This method shows the maximum number of periods as a recession for monthly and quarterly data. The Federal Reserve Bank of St. Louis uses this method in its own publications. One version of this time series is represented using the midpoint method The second interpretation, known as the trough method, is to show a recession from the period following the peak through the trough (i.e. the peak is not included in the recession shading, but the trough is). For daily data, the recession begins on the first day of the first month following the peak and ends on the last day of the month of the trough. Daily data is a disaggregation of monthly data. The trough method is used when displaying data on FRED graphs. The trough method is used for this series.
The third interpretation, known as the peak method, is to show a recession from the period of the peak to the trough (i.e. the peak is included in the recession shading, but the trough is not). For daily data, the recession begins on the first day of the month of the peak and ends on the last day of the month preceding the trough. Daily data is a disaggregation of monthly data. Here is an example of this time series represented using the peak method.
Suggested Citation:
Federal Reserve Bank of St. Louis, NBER based Recession Indicators for the United States from the Period following the Peak through the Trough [USREC], retrieved from FRED, Federal Reserve Bank of St. Louis; https://fred.stlouisfed.org/series/USREC, .
Source: Federal Reserve Bank of St. Louis
Release: Recession Indicators Series
Units:
Frequency:
Notes:
This time series is an interpretation of US Business Cycle Expansions and Contractions data provided by The National Bureau of Economic Research (NBER) at http://www.nber.org/cycles/cyclesmain.html. Our time series is composed of dummy variables that represent periods of expansion and recession. The NBER identifies months and quarters of turning points without designating a date within the period that turning points occurred. The dummy variable adopts an arbitrary convention that the turning point occurred at a specific date within the period. The arbitrary convention does not reflect any judgment on this issue by the NBER's Business Cycle Dating Committee. A value of 1 is a recessionary period, while a value of 0 is an expansionary period. For this time series, the recession begins midpoint of the period of the peak and ends midpoint of the period of the trough. Therefore, the recession period includes the entire period of both peak and trough. For more options on recession shading, see the notes and links below.
The recession shading data that we provide initially comes from the source as a list of dates that are either an economic peak or trough. We interpret dates into recession shading data using one of three arbitrary methods. All of our recession shading data is available using all three interpretations. The period between a peak and trough is always shaded as a recession. The peak and trough are collectively extrema. Depending on the application, the extrema, both individually and collectively, may be included in the recession period in whole or in part. In situations where a portion of a period is included in the recession, the whole period is deemed to be included in the recession period.
The first interpretation, known as the midpoint method, is to show a recession from the midpoint of the peak through the midpoint of the trough for monthly and quarterly data. For daily data, the recession begins on the 15th of the month of the peak and ends on the 15th of the month of the trough. Daily data is a disaggregation of monthly data. For monthly and quarterly data, the entire peak and trough periods are included in the recession shading. This method shows the maximum number of periods as a recession for monthly and quarterly data. The Federal Reserve Bank of St. Louis uses this method in its own publications. The midpoint method is used for this series.
The second interpretation, known as the trough method, is to show a recession from the period following the peak through the trough (i.e. the peak is not included in the recession shading, but the trough is). For daily data, the recession begins on the first day of the first month following the peak and ends on the last day of the month of the trough. Daily data is a disaggregation of monthly data. The trough method is used when displaying data on FRED graphs. A version of this time series represented using the trough method can be found at:
https://fred.stlouisfed.org/series/USREC
The third interpretation, known as the peak method, is to show a recession from the period of the peak to the trough (i.e. the peak is included in the recession shading, but the trough is not). For daily data, the recession begins on the first day of the month of the peak and ends on the last day of the month preceding the trough. Daily data is a disaggregation of monthly data. A version of this time series represented using the peak method can be found at:
https://fred.stlouisfed.org/series/USRECP
Suggested Citation:
Federal Reserve Bank of St. Louis, NBER based Recession Indicators for the United States from the Peak through the Trough [USRECM], retrieved from FRED, Federal Reserve Bank of St. Louis; https://fred.stlouisfed.org/series/USRECM, .
Source: Federal Reserve Bank of St. Louis
Release: Recession Indicators Series
Units:
Frequency:
Notes:
This time series is an interpretation of Organisation of Economic Development (OECD) Composite Leading Indicators: Reference Turning Points and Component Series data provided by the OECD at http://www.oecd.org/std/leading-indicators/oecdcompositeleadingindicatorsreferenceturningpointsandcomponentseries.htm. The OECD identifies months of turning points without designating a date within the month that turning points occurred. The dummy variable adopts an arbitrary convention that the turning point occurred at a specific date within the month. The arbitrary convention does not reflect any judgment on this issue by the OECD. Our time series is composed of dummy variables that represent periods of expansion and recession. A value of 1 is a recessionary period, while a value of 0 is an expansionary period. For this time series, the recession begins the first day of the period following a peak and ends on the last day of the period of the trough. For more options on recession shading, see the notes and links below.
The recession shading data that we provide initially comes from the source as a list of dates that are either an economic peak or trough. We interpret dates into recession shading data using one of three arbitrary methods. All of our recession shading data is available using all three interpretations. The period between a peak and trough is always shaded as a recession. The peak and trough are collectively extrema. Depending on the application, the extrema, both individually and collectively, may be included in the recession period in whole or in part. In situations where a portion of a period is included in the recession, the whole period is deemed to be included in the recession period.
The first interpretation, known as the midpoint method, is to show a recession from the midpoint of the peak through the midpoint of the trough for monthly and quarterly data. For daily data, the recession begins on the 15th of the month of the peak and ends on the 15th of the month of the trough. Daily data is a disaggregation of monthly data. For monthly and quarterly data, the entire peak and trough periods are included in the recession shading. This method shows the maximum number of periods as a recession for monthly and quarterly data. The Federal Reserve Bank of St. Louis uses this method in its own publications. A version of this time series represented using the midpoint method can be found at:
https://fred.stlouisfed.org/series/EURORECM
The second interpretation, known as the trough method, is to show a recession from the period following the peak through the trough (i.e. the peak is not included in the recession shading, but the trough is). For daily data, the recession begins on the first day of the first month following the peak and ends on the last day of the month of the trough. Daily data is a disaggregation of monthly data. The trough method is used when displaying data on FRED graphs. The trough method is used for this series.
The third interpretation, known as the peak method, is to show a recession from the period of the peak to the trough (i.e. the peak is included in the recession shading, but the trough is not). For daily data, the recession begins on the first day of the month of the peak and ends on the last day of the month preceding the trough. Daily data is a disaggregation of monthly data. A version of this time series represented using the peak method can be found at:
https://fred.stlouisfed.org/series/EURORECP
The OECD CLI system is based on the "growth cycle" approach, where business cycles and turning points are measured and identified in the deviation-from-trend series. The main reference series used in the OECD CLI system for the majority of countries is industrial production (IIP) covering all industry sectors excluding construction. This series is used because of its cyclical sensitivity and monthly availability, while the broad based Gross Domestic Product (GDP) is used to supplement the IIP series for identification of the final reference turning points in the growth cycle.
Zones aggregates of the CLIs and the reference series are calculated as weighted averages of the corresponding zone member series (i.e. CLIs and IIPs).
Up to December 2008 the turning points chronologies shown for regional/zone area aggregates or individual countries are determined by the rules established by the National Bureau of Economic Research (NBER) in the United States, which have been formalized and incorporated in a computer routine (Bry and Boschan) and included in the Phase-Average Trend (PAT) de-trending procedure. Starting from December 2008 the turning point detection algorithm is decoupled from the de-trending procedure, and is a simplified version of the original Bry and Boschan routine. (The routine parses local minima and maxima in the cycle series and applies censor rules to guarantee alternating peaks and troughs, as well as phase and cycle length constraints.)
The components of the CLI are time series which exhibit leading relationship with the reference series (IIP) at turning points. Country CLIs are compiled by combining de-trended smoothed and normalized components. The component series for each country are selected based on various criteria such as economic significance; cyclical behavior; data quality; timeliness and availability.
The Euro area covers the Europe 16 area excluding Denmark, Sweden, and United Kingdom.
OECD data should be cited as follows: OECD Composite Leading Indicators, "Composite Leading Indicators: Reference Turning Points and Component Series", http://www.oecd.org/std/leading-indicators/oecdcompositeleadingindicatorsreferenceturningpointsandcomponentseries.htm (Accessed on date)
Suggested Citation:
Federal Reserve Bank of St. Louis, OECD based Recession Indicators for Euro Area from the Period following the Peak through the Trough (DISCONTINUED) [EUROREC], retrieved from FRED, Federal Reserve Bank of St. Louis; https://fred.stlouisfed.org/series/EUROREC, .
Source: S&P Dow Jones Indices LLC
Release: S&P Cotality Case-Shiller Home Price Indices
Units:
Frequency:
Notes:
For more information regarding the index, please visit Standard & Poor's. There is more information about home price sales pairs in the Methodology section. Copyright, 2016, Standard & Poor's Financial Services LLC. Reprinted with permission.
Suggested Citation:
S&P Dow Jones Indices LLC, S&P Cotality Case-Shiller U.S. National Home Price Index [CSUSHPINSA], retrieved from FRED, Federal Reserve Bank of St. Louis; https://fred.stlouisfed.org/series/CSUSHPINSA, .
Source: Board of Governors of the Federal Reserve System (US)
Release: H.6 Money Stock Measures
Units:
Frequency:
Notes:
This weekly series is discontinued and will no longer be updated. The non-seasonally adjusted version of this weekly series is WM2NS, and the seasonally adjusted monthly series is M2SL.
Starting on February 23, 2021, the H.6 statistical release is now published at a monthly frequency and contains only monthly average data needed to construct the monetary aggregates. Weekly average, non-seasonally adjusted data will continue to be made available, while weekly average, seasonally adjusted data will no longer be provided. For further information about the changes to the H.6 statistical release, see the announcements provided by the source.
Before May 2020, M2 consists of M1 plus (1) savings deposits (including money market deposit accounts); (2) small-denomination time deposits (time deposits in amounts of less than $100,000) less individual retirement account (IRA) and Keogh balances at depository institutions; and (3) balances in retail money market funds (MMFs) less IRA and Keogh balances at MMFs.
Beginning May 2020, M2 consists of M1 plus (1) small-denomination time deposits (time deposits in amounts of less than $100,000) less IRA and Keogh balances at depository institutions; and (2) balances in retail MMFs less IRA and Keogh balances at MMFs. Seasonally adjusted M2 is constructed by summing savings deposits (before May 2020), small-denomination time deposits, and retail MMFs, each seasonally adjusted separately, and adding this result to seasonally adjusted M1. For more information on the H.6 release changes and the regulatory amendment that led to the creation of the other liquid deposits component and its inclusion in the M1 monetary aggregate, see the H.6 announcements and Technical Q&As posted on December 17, 2020.
For questions on the data, please contact the data source. For questions on FRED functionality, please contact us here.
Suggested Citation:
Board of Governors of the Federal Reserve System (US), M2 (DISCONTINUED) [M2], retrieved from FRED, Federal Reserve Bank of St. Louis; https://fred.stlouisfed.org/series/M2, .
Source: S&P Dow Jones Indices LLC
Release: Dow Jones Averages
Units:
Frequency:
Notes:
The observations for the Dow Jones Industrial Average represent the daily index value at market close. The market typically closes at 4 PM ET, except for holidays when it sometimes closes early.
The Dow Jones Industrial Average provides a view of the US stock market and economy. Originally, the index was made up of 12 stocks, it now contains 30 component companies in various industries. See indexology for more information.
Copyright © 2016, S&P Dow Jones Indices LLC. All rights reserved. Reproduction of Dow Jones Industrial Average in any form is prohibited except with the prior written permission of S&P Dow Jones Indices LLC ("S&P"). S&P does not guarantee the accuracy, adequacy, completeness or availability of any information and is not responsible for any errors or omissions, regardless of the cause or for the results obtained from the use of such information. S&P DISCLAIMS ANY AND ALL EXPRESS OR IMPLIED WARRANTIES, INCLUDING, BUT NOT LIMITED TO, ANY WARRANTIES OF MERCHANTABILITY OR FITNESS FOR A PARTICULAR PURPOSE OR USE. In no event shall S&P be liable for any direct, indirect, special or consequential damages, costs, expenses, legal fees, or losses (including lost income or lost profit and opportunity costs) in connection with subscriber's or others' use of Dow Jones Industrial Average.
Permission to reproduce this series can be requested from index_services@spdji.com. More contact details are available here, including phone numbers for all regional offices.
Suggested Citation:
S&P Dow Jones Indices LLC, Dow Jones Industrial Average [DJIA], retrieved from FRED, Federal Reserve Bank of St. Louis; https://fred.stlouisfed.org/series/DJIA, .
Release Tables
Gross Domestic Product
- Table 1.1.5. Gross Domestic Product: Quarterly
- Table 1.2.5. Gross Domestic Product by Major Type of Product: Quarterly
- Table 1.3.5. Gross Value Added by Sector: Quarterly
- Table 1.4.5. Relation of Gross Domestic Product, Gross Domestic Purchases, and Final Sales to Domestic Purchasers: Quarterly
- Table 1.5.5. Gross Domestic Product, Expanded Detail: Quarterly
- Table 1.7.5. Relation of Gross Domestic Product, Gross National Product, Net National Product, National Income, and Personal Income: Quarterly
- Table 1.17.5. Gross Domestic Product, Gross Domestic Income, and Other Major NIPA Aggregates: Quarterly
S&P Cotality Case-Shiller Home Price Indices
Related Data and Content
Data Suggestions Based On Your Search


Content Suggestions


Other Formats
Gross Domestic Product
Annual, Not Seasonally Adjusted Annual, Not Seasonally Adjusted Index 2017=100, Quarterly, Not Seasonally Adjusted Millions of Dollars, Quarterly, Not Seasonally Adjusted Percent Change from Preceding Period, Annual, Not Seasonally Adjusted Percent Change from Preceding Period, Quarterly, Seasonally Adjusted Annual RateNBER based Recession Indicators for the United States from the Period following the Peak through the Trough
Daily, Not Seasonally Adjusted Quarterly, Not Seasonally AdjustedNBER based Recession Indicators for the United States from the Peak through the Trough
Daily, Not Seasonally Adjusted Quarterly, Not Seasonally AdjustedOECD based Recession Indicators for Euro Area from the Period following the Peak through the Trough (DISCONTINUED)
Daily, Not Seasonally AdjustedS&P Cotality Case-Shiller U.S. National Home Price Index
Monthly, Seasonally AdjustedRelated Categories
GDP/GNP
National Income & Product Accounts
National Accounts
Business Cycle Expansions & Contractions
Production & Business Activity
Euro Area
Institutions
International Data
House Price Indexes
Prices
M2 and Components
Monetary Data
Money, Banking, & Finance
Stock Market Indexes
Financial Indicators
Releases
More
Series from Gross Domestic Product
More
Series from Recession Indicators Series
More
Series from S&P Cotality Case-Shiller Home Price Indices
More
Series from H.6 Money Stock Measures
More
Series from Dow Jones Averages
Tags
National Income and Product Accounts
Bureau of Economic Analysis
Gross Domestic Product
Quarterly
Seasonally Adjusted
Nation
Public Domain: Citation Requested
United States of America
Peak
Trough
Recession Indicators
National Bureau of Economic Research
St. Louis Fed
Copyrighted: Citation Required
Monthly
Not Seasonally Adjusted
Euro Area
Europe
Transnational
Discontinued
Org. for Economic Co-operation and Development
S&P Cotality Case-Shiller Home Price Indices
S&P Dow Jones Indices LLC
Copyrighted: Pre-Approval Required
House Price Index
Housing
Price Index
Indexes
Price
M2 Money Stock
H.6 Money Stock Measures
Monetary Aggregates
Weekly
Board of Governors
Dow Jones Averages
Dow Jones & Company
Stock Market
Average
Daily
Industry