Federal Reserve Economic Data
Notes
Source: Board of Governors of the Federal Reserve System (US)
Release: H.15 Selected Interest Rates
Units:
Frequency:
Notes:
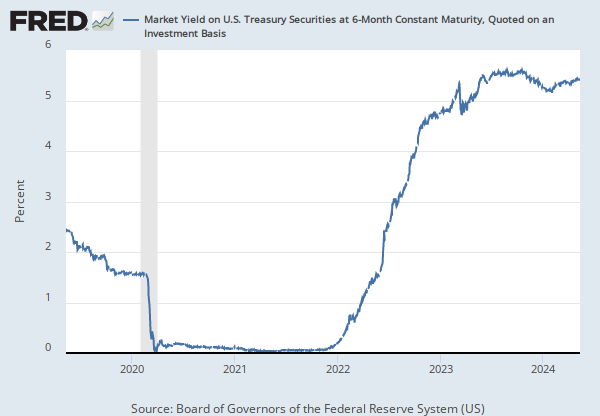
For further information regarding treasury constant maturity data, please refer to the H.15 Statistical Release notes and the Treasury Yield Curve Methodology.
For questions on the data, please contact the data source. For questions on FRED functionality, please contact us here.
Suggested Citation:
Board of Governors of the Federal Reserve System (US), Market Yield on U.S. Treasury Securities at 1-Year Constant Maturity, Quoted on an Investment Basis [DGS1], retrieved from FRED, Federal Reserve Bank of St. Louis; https://fred.stlouisfed.org/series/DGS1, .
Source: Board of Governors of the Federal Reserve System (US)
Release: H.15 Selected Interest Rates
Units:
Frequency:
Notes:
For further information regarding treasury constant maturity data, please refer to the H.15 Statistical Release notes and Treasury Yield Curve Methodology.
For questions on the data, please contact the data source. For questions on FRED functionality, please contact us here.
Suggested Citation:
Board of Governors of the Federal Reserve System (US), Market Yield on U.S. Treasury Securities at 10-Year Constant Maturity, Quoted on an Investment Basis [DGS10], retrieved from FRED, Federal Reserve Bank of St. Louis; https://fred.stlouisfed.org/series/DGS10, .
Source: Hamilton, James
Release: GDP-Based Recession Indicator Index
Units:
Frequency:
Notes:
The series assigns dates to U.S. recessions based on a mathematical model of the way that recessions differ from expansions. Whereas the NBER business cycle dates are based on a subjective assessment of a variety of indicators, the dates here are entirely mechanical and are calculated solely from historically reported GDP data. Whenever the GDP-based recession indicator index rises above 67%, the economy is determined to be in a recession. The date that the recession is determined to have begun is the first quarter prior to that date for which the inference from the mathematical model using all data available at that date would have been above 50%. The next time the GDP-based recession indicator index falls below 33%, the recession is determined to be over, and the last quarter of the recession is the first quarter for which the inference from the mathematical model using all available data at that date would have been below 50%.
For more information about this series visit http://econbrowser.com/recession-index.
Suggested Citation:
Hamilton, James, Dates of U.S. recessions as inferred by GDP-based recession indicator [JHDUSRGDPBR], retrieved from FRED, Federal Reserve Bank of St. Louis; https://fred.stlouisfed.org/series/JHDUSRGDPBR, .
Source: U.S. Bureau of Economic Analysis
Release: Personal Income and Outlays
Units:
Frequency:
Notes:
BEA Account Code: A067RX
AGuide to the National Income and Product Accounts of the United States (NIPA)
Suggested Citation:
U.S. Bureau of Economic Analysis, Real Disposable Personal Income [DSPIC96], retrieved from FRED, Federal Reserve Bank of St. Louis; https://fred.stlouisfed.org/series/DSPIC96, .
Source: Nasdaq, Inc.
Release: Nasdaq Daily Index Data
Units:
Frequency:
Notes:
The observations for the NASDAQ Composite Index represent the daily index value at market close. The market typically closes at 4 PM ET, except for holidays when it sometimes closes early.
The NASDAQ Composite Index is a market capitalization weighted index with more than 3000 common equities listed on the NASDAQ Stock Market. The types of securities in the index include American depositary receipts (ADRs), common stocks, real estate investment trusts (REITs), and tracking stocks. The index includes all NASDAQ listed stocks that are not derivatives, preferred shares, funds, exchange-traded funds (ETFs) or debentures.
Copyright © 2016, NASDAQ OMX Group, Inc.
Suggested Citation:
Nasdaq, Inc., NASDAQ Composite Index [NASDAQCOM], retrieved from FRED, Federal Reserve Bank of St. Louis; https://fred.stlouisfed.org/series/NASDAQCOM, .
Source: Nikkei Industry Research Institute
Release: Nikkei Indexes
Units:
Frequency:
Notes:
The observations for the Nikkei Stock Average, Nikkei 225 represent the daily index value at market close.
Nikkei 225 is the major stock market index comprising of 225 highly liquid stocks of the Tokyo Stock Exchange (TSE).
For in depth information, visit here.
Copyright, 2016, Nikkei Inc. Reprinted with permission.
Downloading the data for research reports or research projects is permitted.
However, if you wish to redistribute the data itself or research reports (information with Nikkei data) to the third parties/persons, the user shall report back to the Nikkei, Inc for permission.
Suggested Citation:
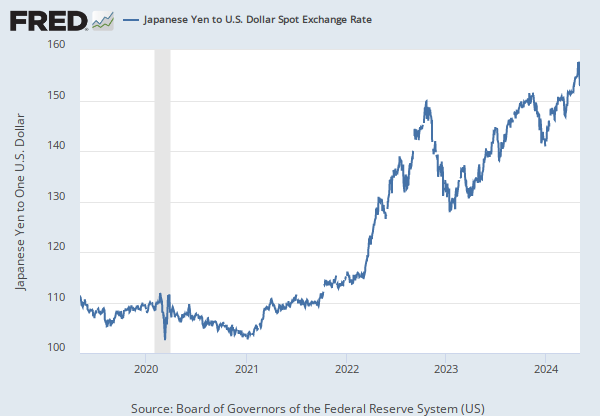
Nikkei Industry Research Institute, Nikkei Stock Average, Nikkei 225 [NIKKEI225], retrieved from FRED, Federal Reserve Bank of St. Louis; https://fred.stlouisfed.org/series/NIKKEI225, .
Release Tables
H.15 Selected Interest Rates
Personal Income and Outlays
Related Data and Content
Data Suggestions Based On Your Search


Content Suggestions


Other Formats
Market Yield on U.S. Treasury Securities at 1-Year Constant Maturity, Quoted on an Investment Basis
Annual, Not Seasonally Adjusted Monthly, Not Seasonally Adjusted Weekly, Not Seasonally AdjustedMarket Yield on U.S. Treasury Securities at 10-Year Constant Maturity, Quoted on an Investment Basis
Annual, Not Seasonally Adjusted Monthly, Not Seasonally Adjusted Weekly, Not Seasonally AdjustedReal Disposable Personal Income
Quarterly, Seasonally Adjusted Annual Rate Percent Change from Preceding Period, Annual, Not Seasonally Adjusted Percent Change from Preceding Period, Quarterly, Seasonally Adjusted Annual Rate Percent Change from Quarter One Year Ago, Quarterly, Seasonally AdjustedRelated Categories
Treasury Constant Maturity
Interest Rates
Money, Banking, & Finance
Recession Probabilities
Academic Data
Business Cycle Expansions & Contractions
Production & Business Activity
Personal Income & Outlays
National Income & Product Accounts
National Accounts
Stock Market Indexes
Financial Indicators
Stock Market Data
Financial Indicators
Money, Banking, & Finance
Indicators
Japan
Countries
International Data
Releases
More
Series from H.15 Selected Interest Rates
More
Series from GDP-Based Recession Indicator Index
More
Series from Personal Income and Outlays
More
Series from Nasdaq Daily Index Data
More
Series from Nikkei Indexes
Tags
1-Year
H.15 Selected Interest Rates
Maturity
Treasury
Interest Rate
Daily
Interest
Board of Governors
Rate
Nation
Public Domain: Citation Requested
United States of America
Not Seasonally Adjusted
10-Year
Hamilton, James
Recession Indicators
Gross Domestic Product
Quarterly
Disposable
Personal Income
Personal
National Income and Product Accounts
Income
Real
Bureau of Economic Analysis
Seasonally Adjusted
Monthly
Composite
National Association of Securities Dealers Automated Quotations
Nasdaq, Inc.
Stock Market
Copyrighted: Pre-Approval Required
Indexes
Copyrighted: Citation Required
Nikkei Inc.
Stocks
Japan