Federal Reserve Economic Data
Notes
Source: U.S. Bureau of Economic Analysis
Release: Gross Domestic Product
Units:
Frequency:
Notes:
BEA Account Code: B075RC
For more information about this series, please see http://www.bea.gov/national/.
Suggested Citation:
U.S. Bureau of Economic Analysis, Federal government current tax receipts: Taxes on corporate income [B075RC1Q027SBEA], retrieved from FRED, Federal Reserve Bank of St. Louis; https://fred.stlouisfed.org/series/B075RC1Q027SBEA, .
Source: U.S. Bureau of Economic Analysis
Release: Gross Domestic Product
Units:
Frequency:
Notes:
BEA Account Code: W013RC
A Guide to the National Income and Product Accounts of the United States (NIPA) - (http://www.bea.gov/national/pdf/nipaguid.pdf)
Suggested Citation:
U.S. Bureau of Economic Analysis, Federal Government: Current Expenditures [FGEXPND], retrieved from FRED, Federal Reserve Bank of St. Louis; https://fred.stlouisfed.org/series/FGEXPND, .
Source: U.S. Bureau of Economic Analysis
Release: Gross Domestic Product
Units:
Frequency:
Notes:
BEA Account Code: W006RC
Visit the BEA for more information about this series.
Suggested Citation:
U.S. Bureau of Economic Analysis, Federal government current tax receipts [W006RC1Q027SBEA], retrieved from FRED, Federal Reserve Bank of St. Louis; https://fred.stlouisfed.org/series/W006RC1Q027SBEA, .
Source: U.S. Bureau of Economic Analysis
Release: Gross Domestic Product
Units:
Frequency:
Notes:
BEA Account Code: W024RC
A Guide to the National Income and Product Accounts of the United States (NIPA) - (http://www.bea.gov/national/pdf/nipaguid.pdf)
Suggested Citation:
U.S. Bureau of Economic Analysis, State and Local Government Current Expenditures [SLEXPND], retrieved from FRED, Federal Reserve Bank of St. Louis; https://fred.stlouisfed.org/series/SLEXPND, .
Source: U.S. Bureau of Economic Analysis
Release: Gross Domestic Product
Units:
Frequency:
Notes:
BEA Account Code: B248RC
For more information about this series, please see http://www.bea.gov/national/.
Suggested Citation:
U.S. Bureau of Economic Analysis, State and local government current tax receipts: Taxes on production and imports: Sales taxes [B248RC1Q027SBEA], retrieved from FRED, Federal Reserve Bank of St. Louis; https://fred.stlouisfed.org/series/B248RC1Q027SBEA, .
Source: Board of Governors of the Federal Reserve System (US)
Release: Z.1 Financial Accounts of the United States
Units:
Frequency:
Notes:
For more information about the Flow of Funds tables, see the Financial Accounts Guide.
With each quarterly release, the source may make major data and structural revisions to the series and tables. These changes are available in the Release Highlights.
In the Financial Accounts, the source identifies each series by a string of patterned letters and numbers. For a detailed description, including how this series is constructed, see the series analyzer provided by the source.
Suggested Citation:
Board of Governors of the Federal Reserve System (US), Households; Checkable Deposits and Currency; Asset, Level [BOGZ1FL193020005Q], retrieved from FRED, Federal Reserve Bank of St. Louis; https://fred.stlouisfed.org/series/BOGZ1FL193020005Q, .
Source: Board of Governors of the Federal Reserve System (US)
Release: Z.1 Financial Accounts of the United States
Units:
Frequency:
Notes:
For more information about the Flow of Funds tables, see the Financial Accounts Guide.
With each quarterly release, the source may make major data and structural revisions to the series and tables. These changes are available in the Release Highlights.
In the Financial Accounts, the source identifies each series by a string of patterned letters and numbers. For a detailed description, including how this series is constructed, see the series analyzer provided by the source.
Suggested Citation:
Board of Governors of the Federal Reserve System (US), Nonfinancial Corporate Business; Checkable Deposits and Currency; Asset (Excluding Ereits), Level [NCBCDCA], retrieved from FRED, Federal Reserve Bank of St. Louis; https://fred.stlouisfed.org/series/NCBCDCA, .
Source: Board of Governors of the Federal Reserve System (US)
Release: Z.1 Financial Accounts of the United States
Units:
Frequency:
Notes:
For more information about the Flow of Funds tables, see the Financial Accounts Guide.
With each quarterly release, the source may make major data and structural revisions to the series and tables. These changes are available in the Release Highlights.
In the Financial Accounts, the source identifies each series by a string of patterned letters and numbers. For a detailed description, including how this series is constructed, see the series analyzer provided by the source.
Suggested Citation:
Board of Governors of the Federal Reserve System (US), Households and Nonprofit Organizations; Total Time and Savings Deposits; Asset, Level [TSDABSHNO], retrieved from FRED, Federal Reserve Bank of St. Louis; https://fred.stlouisfed.org/series/TSDABSHNO, .
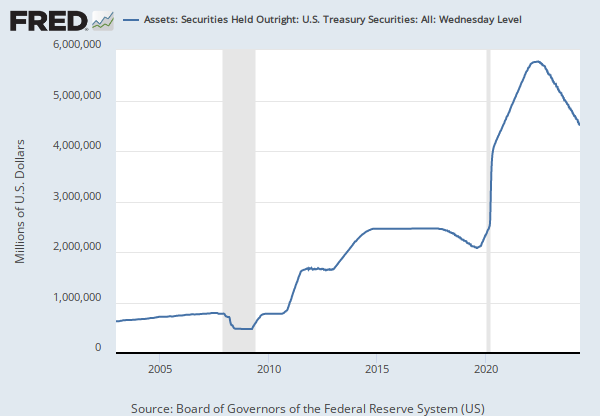
Source: Board of Governors of the Federal Reserve System (US)
Release: H.4.1 Factors Affecting Reserve Balances
Units:
Frequency:
Notes:
For questions on the data, please contact the data source. For questions on FRED functionality, please contact us here.
Suggested Citation:
Board of Governors of the Federal Reserve System (US), Assets: Securities Held Outright: U.S. Treasury Securities: All: Wednesday Level [TREAST], retrieved from FRED, Federal Reserve Bank of St. Louis; https://fred.stlouisfed.org/series/TREAST, .
Source: U.S. Bureau of Labor Statistics
Release: Consumer Price Index
Units:
Frequency:
Notes:
The Consumer Price Index for All Urban Consumers: All Items (CPIAUCSL) is a price index of a basket of goods and services paid by urban consumers. Percent changes in the price index measure the inflation rate between any two time periods. The most common inflation metric is the percent change from one year ago. It can also represent the buying habits of urban consumers. This particular index includes roughly 88 percent of the total population, accounting for wage earners, clerical workers, technical workers, self-employed, short-term workers, unemployed, retirees, and those not in the labor force.
The CPIs are based on prices for food, clothing, shelter, and fuels; transportation fares; service fees (e.g., water and sewer service); and sales taxes. Prices are collected monthly from about 4,000 housing units and approximately 26,000 retail establishments across 87 urban areas. To calculate the index, price changes are averaged with weights representing their importance in the spending of the particular group. The index measures price changes (as a percent change) from a predetermined reference date. In addition to the original unadjusted index distributed, the Bureau of Labor Statistics also releases a seasonally adjusted index. The unadjusted series reflects all factors that may influence a change in prices. However, it can be very useful to look at the seasonally adjusted CPI, which removes the effects of seasonal changes, such as weather, school year, production cycles, and holidays.
The CPI can be used to recognize periods of inflation and deflation. Significant increases in the CPI within a short time frame might indicate a period of inflation, and significant decreases in CPI within a short time frame might indicate a period of deflation. However, because the CPI includes volatile food and oil prices, it might not be a reliable measure of inflationary and deflationary periods. For a more accurate detection, the core CPI (CPILFESL) is often used. When using the CPI, please note that it is not applicable to all consumers and should not be used to determine relative living costs. Additionally, the CPI is a statistical measure vulnerable to sampling error since it is based on a sample of prices and not the complete average.
For more information on the CPI, see the Handbook of Methods, the release notes and announcements, and the Frequently Asked Questions (FAQs).
Suggested Citation:
U.S. Bureau of Labor Statistics, Consumer Price Index for All Urban Consumers: All Items in U.S. City Average [CPIAUCSL], retrieved from FRED, Federal Reserve Bank of St. Louis; https://fred.stlouisfed.org/series/CPIAUCSL, .
Source: Board of Governors of the Federal Reserve System (US)
Release: H.4.1 Factors Affecting Reserve Balances
Units:
Frequency:
Notes:
For questions on the data, please contact the data source. For questions on FRED functionality, please contact us here.
Suggested Citation:
Board of Governors of the Federal Reserve System (US), Assets: Total Assets: Total Assets: Wednesday Level [RESPPANWW], retrieved from FRED, Federal Reserve Bank of St. Louis; https://fred.stlouisfed.org/series/RESPPANWW, .
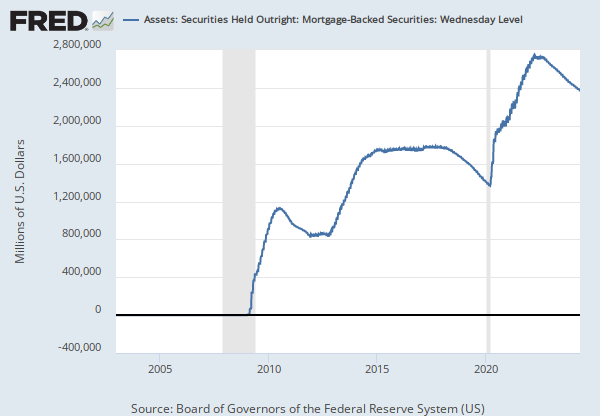
Source: Board of Governors of the Federal Reserve System (US)
Release: H.4.1 Factors Affecting Reserve Balances
Units:
Frequency:
Notes:
For questions on the data, please contact the data source. For questions on FRED functionality, please contact us here.
Suggested Citation:
Board of Governors of the Federal Reserve System (US), Assets: Securities Held Outright: Mortgage-Backed Securities: Wednesday Level [WSHOMCB], retrieved from FRED, Federal Reserve Bank of St. Louis; https://fred.stlouisfed.org/series/WSHOMCB, .
Source: U.S. Bureau of Economic Analysis
Release: Personal Income and Outlays
Units:
Frequency:
Notes:
BEA Account Code: DPCCRG
The Personal Consumption Expenditures Price Index is a measure of the prices that people living in the United States, or those buying on their behalf, pay for goods and services. The change in the PCE price index is known for capturing inflation (or deflation) across a wide range of consumer expenses and reflecting changes in consumer behavior. For example, if car prices rise, car sales may decline while bicycle sales increase.
The PCE Price Index is produced by the Bureau of Economic Analysis (BEA), which revises previously published PCE data to reflect updated information or new methodology, providing consistency across decades of data that's valuable for researchers. They also offer the series as a Chain-Type index and excluding food and energy products, as above. The PCE price index less food excluding food and energy is used primarily for macroeconomic analysis and forecasting future values of the PCE price index.
The PCE Price Index is similar to the Bureau of Labor Statistics' consumer price index for urban consumers. The two indexes, which have their own purposes and uses, are constructed differently, resulting in different inflation rates.
For more information on the PCE price index, see:
U.S. Bureau of Economic Analysis, Guide to the National Income and Product Accounts of the United States (NIPA)
U.S. Bureau of Economic Analysis, Personal Consumption Expenditures Price Index
U.S. Bureau of Economic Analysis, Prices & Inflation
U.S. Bureau of Labor Statistics, Differences between the Consumer Price Index and the Personal Consumption Expenditure Price Index
Suggested Citation:
U.S. Bureau of Economic Analysis, Personal Consumption Expenditures Excluding Food and Energy (Chain-Type Price Index) [PCEPILFE], retrieved from FRED, Federal Reserve Bank of St. Louis; https://fred.stlouisfed.org/series/PCEPILFE, .
Source: U.S. Bureau of Economic Analysis
Release: Gross Domestic Product
Units:
Frequency:
Notes:
BEA Account Code: A822RE
For more information about this series, please see http://www.bea.gov/national/.
Suggested Citation:
U.S. Bureau of Economic Analysis, Shares of gross domestic product: Government consumption expenditures and gross investment [A822RE1Q156NBEA], retrieved from FRED, Federal Reserve Bank of St. Louis; https://fred.stlouisfed.org/series/A822RE1Q156NBEA, .
Source: U.S. Bureau of Economic Analysis
Release: Gross Domestic Product
Units:
Frequency:
Notes:
BEA Account Code: A191RC
Gross domestic product (GDP), the featured measure of U.S. output, is the market value of the goods and services produced by labor and property located in the United States.For more information, see the Guide to the National Income and Product Accounts of the United States (NIPA) and the Bureau of Economic Analysis.
Suggested Citation:
U.S. Bureau of Economic Analysis, Gross Domestic Product [GDP], retrieved from FRED, Federal Reserve Bank of St. Louis; https://fred.stlouisfed.org/series/GDP, .
Source: U.S. Bureau of Economic Analysis
Release: Gross Domestic Product
Units:
Frequency:
Notes:
BEA Account Code: A006RC
A Guide to the National Income and Product Accounts of the United States (NIPA)
Suggested Citation:
U.S. Bureau of Economic Analysis, Gross Private Domestic Investment [GPDI], retrieved from FRED, Federal Reserve Bank of St. Louis; https://fred.stlouisfed.org/series/GPDI, .
Release Tables
Consumer Price Index
Gross Domestic Product
- Table 1.1.5. Gross Domestic Product: Quarterly
- Table 1.1.10. Percentage Shares of Gross Domestic Product: Quarterly
- Table 1.2.5. Gross Domestic Product by Major Type of Product: Quarterly
- Table 1.3.5. Gross Value Added by Sector: Quarterly
- Table 1.4.5. Relation of Gross Domestic Product, Gross Domestic Purchases, and Final Sales to Domestic Purchasers: Quarterly
- Table 1.5.5. Gross Domestic Product, Expanded Detail: Quarterly
- Table 1.7.5. Relation of Gross Domestic Product, Gross National Product, Net National Product, National Income, and Personal Income: Quarterly
- Table 1.17.5. Gross Domestic Product, Gross Domestic Income, and Other Major NIPA Aggregates: Quarterly
- Table 3.2. Federal Government Current Receipts and Expenditures: Quarterly
- Table 3.3. State and Local Government Current Receipts and Expenditures: Quarterly
- Table 3.5. Taxes on Production and Imports: Quarterly
- Table 3.16. Government Current Expenditures by Function: Quarterly
- Table 5.1. Saving and Investment by Sector: Quarterly
- Table 5.2.5. Gross and Net Domestic Investment by Major Type: Quarterly
H.4.1 Factors Affecting Reserve Balances
- Table 1. Factors Affecting Reserve Balances of Depository Institutions: Wednesday Level
- Table 2. Maturity Distribution of Securities, Loans, and Selected Other Assets and Liabilities
- Table 3. Supplemental Information on Mortgage-Backed Securities
- Table 5. Consolidated Statement of Condition of All Federal Reserve Banks
- Table 6. Statement of Condition of Each Federal Reserve Bank
Personal Income and Outlays
Z.1 Financial Accounts of the United States
- Quarterly: L.101 Households and Nonprofit Organizations
- Quarterly: L.103 Nonfinancial Corporate Business
- Quarterly: L.204 Checkable Deposits and Currency
- Quarterly: L.205 Time and Savings Deposits
- B.101 Balance Sheet of Households and Nonprofit Organizations
- B.103 Balance Sheet of Nonfinancial Corporate Business
- Quarterly: B.101.h Balance Sheet of Households
- S.3.q Households and Nonprofit Institutions Serving Households
- Quarterly Tables: S.5.q Nonfinancial Corporate Business
Related Data and Content
Data Suggestions Based On Your Search


Content Suggestions


Other Formats
Federal government current tax receipts: Taxes on corporate income
Millions of Dollars, Quarterly, Not Seasonally AdjustedFederal Government: Current Expenditures
Millions of Dollars, Quarterly, Not Seasonally AdjustedFederal government current tax receipts
Annual, Not Seasonally Adjusted Millions of Dollars, Quarterly, Not Seasonally AdjustedState and Local Government Current Expenditures
Annual, Not Seasonally AdjustedHouseholds; Checkable Deposits and Currency; Asset, Level
Annual, Not Seasonally AdjustedNonfinancial Corporate Business; Checkable Deposits and Currency; Asset (Excluding Ereits), Level
Annual, Not Seasonally AdjustedHouseholds and Nonprofit Organizations; Total Time and Savings Deposits; Asset, Level
Annual, Not Seasonally AdjustedConsumer Price Index for All Urban Consumers: All Items in U.S. City Average
Monthly, Not Seasonally Adjusted Semiannual, Not Seasonally AdjustedPersonal Consumption Expenditures Excluding Food and Energy (Chain-Type Price Index)
Percent Change from Quarter One Year Ago, Quarterly, Seasonally AdjustedShares of gross domestic product: Government consumption expenditures and gross investment
Annual, Not Seasonally AdjustedGross Domestic Product
Annual, Not Seasonally Adjusted Annual, Not Seasonally Adjusted Index 2017=100, Quarterly, Not Seasonally Adjusted Millions of Dollars, Quarterly, Not Seasonally Adjusted Percent Change from Preceding Period, Annual, Not Seasonally Adjusted Percent Change from Preceding Period, Quarterly, Seasonally Adjusted Annual RateGross Private Domestic Investment
Annual, Not Seasonally Adjusted Index 2017=100, Quarterly, Not Seasonally Adjusted Millions of Dollars, Quarterly, Not Seasonally AdjustedRelated Categories
Taxes on Corporate Income
Private Enterprise Income
National Income & Product Accounts
National Accounts
Gov't Receipts, Expenditures & Investment
Flow of Funds
B.103 Balance Sheet of Nonfinancial Corporate Business
B.101 Balance Sheet of Households and Nonprofit Organizations
Securities, Loans, & Other Assets & Liabilities Held by Fed
Monetary Data
Money, Banking, & Finance
Consumer Price Indexes (CPI and PCE)
Prices
Factors Affecting Reserve Balances
Price Indexes & Deflators
Shares of GDP
GDP/GNP
Domestic Capital Account (Saving & Investment)
Releases
More
Series from Gross Domestic Product
More
Series from Z.1 Financial Accounts of the United States
More
Series from H.4.1 Factors Affecting Reserve Balances
More
Series from Consumer Price Index
More
Series from Personal Income and Outlays
Tags
Receipts
Tax
Corporate
Federal
National Income and Product Accounts
Government
Income
Bureau of Economic Analysis
Gross Domestic Product
Quarterly
Seasonally Adjusted
Nation
Public Domain: Citation Requested
United States of America
Expenditures
State & Local
Sales Taxes
Imports
Sales
Production
Checkable
Deposits
Currency
Households
Assets
Z.1 US Financial Accounts
Board of Governors
Not Seasonally Adjusted
Nonfinancial
Business
Balance Sheet
Savings
Nonprofit Organizations
H.4.1 Factors Affecting Reserve Balances
Maturity
Treasury
Securities
Weekly
Headline Figure
All Items
Average
Urban
Consumer
Consumer Price Index
Inflation
Price Index
Indexes
Price
Bureau of Labor Statistics
Monthly
Outright
Mortgage-Backed
Core Inflation
Chained
Energy
Personal Consumption Expenditures
Consumption Expenditures
Consumption
Personal
Shares of Gross Domestic Product
Investment
Gross
Domestic
Private