Notes
Source: U.S. Bureau of Economic Analysis
Release: Gross Domestic Product
Units:
Frequency:
Notes:
BEA Account Code: W013RC
A Guide to the National Income and Product Accounts of the United States (NIPA) - (http://www.bea.gov/national/pdf/nipaguid.pdf)
Suggested Citation:
U.S. Bureau of Economic Analysis, Federal Government: Current Expenditures [FGEXPND], retrieved from FRED, Federal Reserve Bank of St. Louis; https://fred.stlouisfed.org/series/FGEXPND, .
Source: U.S. Bureau of Economic Analysis
Release: Gross Domestic Product
Units:
Frequency:
Notes:
BEA Account Code: NA000334
Suggested Citation:
U.S. Bureau of Economic Analysis, Gross Domestic Product [NA000334Q], retrieved from FRED, Federal Reserve Bank of St. Louis; https://fred.stlouisfed.org/series/NA000334Q, .
Source: U.S. Bureau of Economic Analysis
Release: Personal Income and Outlays
Units:
Frequency:
Notes:
BEA Account Code: DPCERC
A Guide to the National Income and Product Accounts of the United States (NIPA).
Suggested Citation:
U.S. Bureau of Economic Analysis, Personal Consumption Expenditures [PCE], retrieved from FRED, Federal Reserve Bank of St. Louis; https://fred.stlouisfed.org/series/PCE, .
Source: Board of Governors of the Federal Reserve System (US)
Release: Z.1 Financial Accounts of the United States
Units:
Frequency:
Notes:
For more information about the Flow of Funds tables, see the Financial Accounts Guide.
With each quarterly release, the source may make major data and structural revisions to the series and tables. These changes are available in the Release Highlights.
In the Financial Accounts, the source identifies each series by a string of patterned letters and numbers. For a detailed description, including how this series is constructed, see the series analyzer provided by the source.
Suggested Citation:
Board of Governors of the Federal Reserve System (US), Nonfinancial Corporate Business; Total Capital Expenditures, Transactions [BOGZ1FA105050005Q], retrieved from FRED, Federal Reserve Bank of St. Louis; https://fred.stlouisfed.org/series/BOGZ1FA105050005Q, .
Source: U.S. Bureau of Economic Analysis
Release: Gross Domestic Product
Units:
Frequency:
Notes:
BEA Account Code: DIFSRC
For more information about this series, please see http://www.bea.gov/national/.
Suggested Citation:
U.S. Bureau of Economic Analysis, Personal consumption expenditures: Financial services and insurance [DIFSRC1Q027SBEA], retrieved from FRED, Federal Reserve Bank of St. Louis; https://fred.stlouisfed.org/series/DIFSRC1Q027SBEA, .
Source: U.S. Bureau of Economic Analysis
Release: Gross Domestic Product
Units:
Frequency:
Notes:
BEA Account Code: DMOTRC
For more information about this series, please see http://www.bea.gov/national/.
Suggested Citation:
U.S. Bureau of Economic Analysis, Personal consumption expenditures: Durable goods: Motor vehicles and parts [DMOTRC1Q027SBEA], retrieved from FRED, Federal Reserve Bank of St. Louis; https://fred.stlouisfed.org/series/DMOTRC1Q027SBEA, .
Source: U.S. Bureau of Economic Analysis
Release: Supplemental Estimates, Underlying Detail Tables
Units:
Frequency:
Notes:
BEA Account Code: DHSGRC
For further information, please visit the source website at http://www.bea.gov/national/ .
Suggested Citation:
U.S. Bureau of Economic Analysis, Personal Consumption Expenditures by Type of Product: Services: Household Consumption Expenditures: Housing [DHSGRC0], retrieved from FRED, Federal Reserve Bank of St. Louis; https://fred.stlouisfed.org/series/DHSGRC0, .
Source: U.S. Bureau of Economic Analysis
Release: Personal Income and Outlays
Units:
Frequency:
Notes:
BEA Account Code: DFXARC
For more information about this series, please see http://www.bea.gov/national/.
Suggested Citation:
U.S. Bureau of Economic Analysis, Personal consumption expenditures: Food [DFXARC1M027SBEA], retrieved from FRED, Federal Reserve Bank of St. Louis; https://fred.stlouisfed.org/series/DFXARC1M027SBEA, .
Source: U.S. Bureau of Economic Analysis
Release: Gross Domestic Product
Units:
Frequency:
Notes:
BEA Account Code: DHLCRC
For more information about this series, please see http://www.bea.gov/national/.
Suggested Citation:
U.S. Bureau of Economic Analysis, Personal consumption expenditures: Services: Health care [DHLCRC1Q027SBEA], retrieved from FRED, Federal Reserve Bank of St. Louis; https://fred.stlouisfed.org/series/DHLCRC1Q027SBEA, .
Source: U.S. Bureau of Economic Analysis
Release: Gross Domestic Product
Units:
Frequency:
Notes:
BEA Account Code: DTRSRC
For more information about this series, please see http://www.bea.gov/national/.
Suggested Citation:
U.S. Bureau of Economic Analysis, Personal consumption expenditures: Transportation services [DTRSRC1Q027SBEA], retrieved from FRED, Federal Reserve Bank of St. Louis; https://fred.stlouisfed.org/series/DTRSRC1Q027SBEA, .
Source: U.S. Bureau of Economic Analysis
Release: Gross Domestic Product
Units:
Frequency:
Notes:
BEA Account Code: DGOERC
For more information about this series, please see http://www.bea.gov/national/.
Suggested Citation:
U.S. Bureau of Economic Analysis, Personal consumption expenditures: Nondurable goods: Gasoline and other energy goods [DGOERC1Q027SBEA], retrieved from FRED, Federal Reserve Bank of St. Louis; https://fred.stlouisfed.org/series/DGOERC1Q027SBEA, .
Source: U.S. Bureau of Economic Analysis
Release: Personal Income and Outlays
Units:
Frequency:
Notes:
BEA Account Code: DPCERX
A Guide to the National Income and Product Accounts of the United States (NIPA)
Suggested Citation:
U.S. Bureau of Economic Analysis, Real Personal Consumption Expenditures [PCEC96], retrieved from FRED, Federal Reserve Bank of St. Louis; https://fred.stlouisfed.org/series/PCEC96, .
Source: Board of Governors of the Federal Reserve System (US)
Release: Z.1 Financial Accounts of the United States
Units:
Frequency:
Notes:
For more information about the Flow of Funds tables, see the Financial Accounts Guide.
With each quarterly release, the source may make major data and structural revisions to the series and tables. These changes are available in the Release Highlights.
In the Financial Accounts, the source identifies each series by a string of patterned letters and numbers. For a detailed description, including how this series is constructed, see the series analyzer provided by the source.
Suggested Citation:
Board of Governors of the Federal Reserve System (US), All Sectors; Total Mortgages; Asset, Level [ASTMA], retrieved from FRED, Federal Reserve Bank of St. Louis; https://fred.stlouisfed.org/series/ASTMA, .
Source: U.S. Census Bureau
Release: National Population Estimates
Units:
Frequency:
Notes:
The intercensal estimates for 1990-2000 for the United States population are produced by converting the 1990-2000 postcensal estimates prepared previously for the U. S. to account for differences between the postcensal estimates in 2000 and census counts (error of closure). The postcensal estimates for 1990 to 2000 were produced by updating the resident population enumerated in the 1990 census by estimates of the components of population change between April 1, 1990 and April 1, 2000-- births to U.S. resident women, deaths to U.S. residents, net international migration (incl legal & residual foreign born), and net movement of the U.S. armed forces and civilian citizens to the United States. Intercensal population estimates for 1990 to 2000 are derived from the postcensal estimates by distributing the error of closure over the decade by month. The method used for the 1990s for distributing the error of closure is the same that was used for the 1980s. This method produces an intercensal estimate as a function of time and the postcensal estimates,using the following formula: the population at time t is equal to the postcensal estimate at time t multiplied by a function. The function is the April 1, 2000 census count divided by the April 1, 2000 postcensal estimate raised to the power of t divided by 3653.
Suggested Citation:
U.S. Census Bureau, Total Population: All Ages including Armed Forces Overseas [POP], retrieved from FRED, Federal Reserve Bank of St. Louis; https://fred.stlouisfed.org/series/POP, .
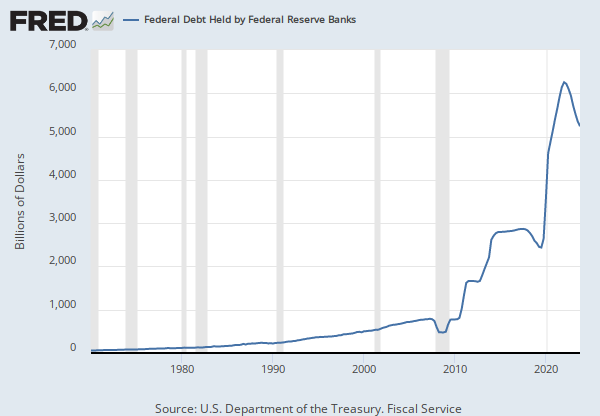
Source: U.S. Department of the Treasury. Fiscal Service
Release: Treasury Bulletin
Units:
Frequency:
Suggested Citation:
U.S. Department of the Treasury. Fiscal Service, Federal Debt: Total Public Debt [GFDEBTN], retrieved from FRED, Federal Reserve Bank of St. Louis; https://fred.stlouisfed.org/series/GFDEBTN, .
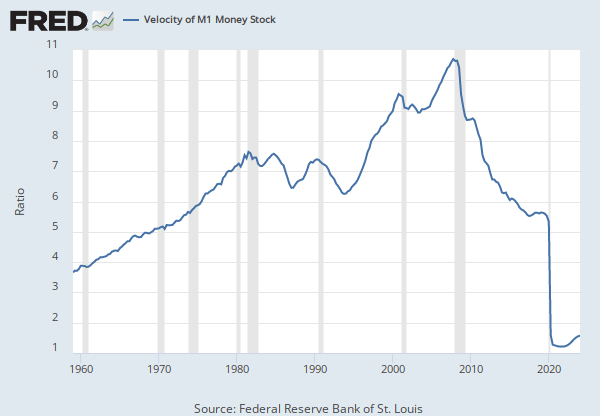
Source: Federal Reserve Bank of St. Louis
Release: Money Velocity
Units:
Frequency:
Notes:
Calculated as the ratio of quarterly nominal GDP to the quarterly average of M2 money stock.
The velocity of money is the frequency at which one unit of currency is used to purchase domestically- produced goods and services within a given time period. In other words, it is the number of times one dollar is spent to buy goods and services per unit of time. If the velocity of money is increasing, then more transactions are occurring between individuals in an economy.
The frequency of currency exchange can be used to determine the velocity of a given component of the money supply, providing some insight into whether consumers and businesses are saving or spending their money. There are several components of the money supply,: M1, M2, and MZM (M3 is no longer tracked by the Federal Reserve); these components are arranged on a spectrum of narrowest to broadest. Consider M1, the narrowest component. M1 is the money supply of currency in circulation (notes and coins, traveler's checks [non-bank issuers], demand deposits, and checkable deposits). A decreasing velocity of M1 might indicate fewer short- term consumption transactions are taking place. We can think of shorter- term transactions as consumption we might make on an everyday basis.
Beginning May 2020, M2 consists of M1 plus (1) small-denomination time deposits (time deposits in amounts of less than $100,000) less IRA and Keogh balances at depository institutions; and (2) balances in retail MMFs less IRA and Keogh balances at MMFs. Seasonally adjusted M2 is constructed by summing savings deposits (before May 2020), small-denomination time deposits, and retail MMFs, each seasonally adjusted separately, and adding this result to seasonally adjusted M1. For more information on the H.6 release changes and the regulatory amendment that led to the creation of the other liquid deposits component and its inclusion in the M1 monetary aggregate, see the H.6 announcements and Technical Q&As posted on December 17, 2020.
MZM (money with zero maturity) is the broadest component and consists of the supply of financial assets redeemable at par on demand: notes and coins in circulation, traveler's checks (non-bank issuers), demand deposits, other checkable deposits, savings deposits, and all money market funds. The velocity of MZM helps determine how often financial assets are switching hands within the economy.
Suggested Citation:
Federal Reserve Bank of St. Louis, Velocity of M2 Money Stock [M2V], retrieved from FRED, Federal Reserve Bank of St. Louis; https://fred.stlouisfed.org/series/M2V, .
Source: U.S. Bureau of Economic Analysis
Release: Gross Domestic Product
Units:
Frequency:
Notes:
BEA Account Code: A191RC
Gross domestic product (GDP), the featured measure of U.S. output, is the market value of the goods and services produced by labor and property located in the United States.For more information, see the Guide to the National Income and Product Accounts of the United States (NIPA) and the Bureau of Economic Analysis.
Suggested Citation:
U.S. Bureau of Economic Analysis, Gross Domestic Product [GDP], retrieved from FRED, Federal Reserve Bank of St. Louis; https://fred.stlouisfed.org/series/GDP, .
Source: Board of Governors of the Federal Reserve System (US)
Release: H.6 Money Stock Measures
Units:
Frequency:
Notes:
Before May 2020, M2 consists of M1 plus (1) savings deposits (including money market deposit accounts); (2) small-denomination time deposits (time deposits in amounts of less than $100,000) less individual retirement account (IRA) and Keogh balances at depository institutions; and (3) balances in retail money market funds (MMFs) less IRA and Keogh balances at MMFs.
Beginning May 2020, M2 consists of M1 plus (1) small-denomination time deposits (time deposits in amounts of less than $100,000) less IRA and Keogh balances at depository institutions; and (2) balances in retail MMFs less IRA and Keogh balances at MMFs. Seasonally adjusted M2 is constructed by summing savings deposits (before May 2020), small-denomination time deposits, and retail MMFs, each seasonally adjusted separately, and adding this result to seasonally adjusted M1.
For more information on the H.6 release changes and the regulatory amendment that led to the creation of the other liquid deposits component and its inclusion in the M1 monetary aggregate, see the H.6 announcements and Technical Q&As posted on December 17, 2020.
For questions on the data, please contact the data source. For questions on FRED functionality, please contact us here.
Suggested Citation:
Board of Governors of the Federal Reserve System (US), M2 [M2SL], retrieved from FRED, Federal Reserve Bank of St. Louis; https://fred.stlouisfed.org/series/M2SL, .
Source: Board of Governors of the Federal Reserve System (US)
Release: H.6 Money Stock Measures
Units:
Frequency:
Notes:
The currency component of M1, sometimes called "money stock currency," is defined as currency in circulation outside the U.S. Treasury, Federal Reserve Banks, and vaults of depository institutions. Data on total currency in circulation are obtained weekly from balance sheets of the Federal Reserve Banks and from the U.S. Treasury. Weekly currency in circulation data are published each week on the Federal Reserve Board's H.4.1 statistical release "Factors Affecting Reserve Balances of Depository Institutions and Condition Statement of Federal Reserve Banks." Vault cash is reported on the FR 2900 and subtracted from total currency in circulation. For institutions that do not file the FR 2900, vault cash is estimated using data reported on the Call Reports.
For questions on the data, please contact the data source. For questions on FRED functionality, please contact us here.
Suggested Citation:
Board of Governors of the Federal Reserve System (US), Currency Component of M1 [CURRSL], retrieved from FRED, Federal Reserve Bank of St. Louis; https://fred.stlouisfed.org/series/CURRSL, .
Release Tables
Gross Domestic Product
- Table 1.1.5. Gross Domestic Product: Quarterly
- Table 1.2.5. Gross Domestic Product by Major Type of Product: Quarterly
- Table 1.3.5. Gross Value Added by Sector: Quarterly
- Table 1.4.5. Relation of Gross Domestic Product, Gross Domestic Purchases, and Final Sales to Domestic Purchasers: Quarterly
- Table 1.5.5. Gross Domestic Product, Expanded Detail: Quarterly
- Table 1.7.5. Relation of Gross Domestic Product, Gross National Product, Net National Product, National Income, and Personal Income: Quarterly
- Table 1.17.5. Gross Domestic Product, Gross Domestic Income, and Other Major NIPA Aggregates: Quarterly
- Table 2.3.5. Personal Consumption Expenditures by Major Type of Product: Quarterly
- Table 3.2. Federal Government Current Receipts and Expenditures: Quarterly
- Table 3.16. Government Current Expenditures by Function: Quarterly
- Table 8.1.5. Gross Domestic Product, Not Seasonally Adjusted, Quarterly
H.6 Money Stock Measures
Personal Income and Outlays
- Table 2.6. Personal Income and Its Disposition, Monthly
- Table 2.8.5. Personal Consumption Expenditures by Major Type of Product, Billions of Dollars
- Table 2.8.6. Real Personal Consumption Expenditures by Major Type of Product, Chained Dollars
Z.1 Financial Accounts of the United States
Related Data and Content
Data Suggestions Based On Your Search


Content Suggestions


Other Formats
Federal Government: Current Expenditures
Millions of Dollars, Quarterly, Not Seasonally AdjustedGross Domestic Product
Billions of Dollars, Annual, Not Seasonally Adjusted Billions of Dollars, Annual, Not Seasonally Adjusted Billions of Dollars, Quarterly, Seasonally Adjusted Annual Rate Index 2017=100, Quarterly, Not Seasonally Adjusted Percent Change from Preceding Period, Annual, Not Seasonally Adjusted Percent Change from Preceding Period, Quarterly, Seasonally Adjusted Annual RatePersonal Consumption Expenditures
Annual, Not Seasonally Adjusted Quarterly, Seasonally Adjusted Annual Rate Index 2017=100, Quarterly, Not Seasonally Adjusted Millions of Dollars, Quarterly, Not Seasonally AdjustedNonfinancial Corporate Business; Total Capital Expenditures, Transactions
Annual, Not Seasonally Adjusted Annual, Seasonally Adjusted Annual Rate Quarterly, Not Seasonally AdjustedPersonal consumption expenditures: Financial services and insurance
Annual, Not Seasonally AdjustedPersonal consumption expenditures: Durable goods: Motor vehicles and parts
Annual, Not Seasonally AdjustedPersonal consumption expenditures: Services: Health care
Annual, Not Seasonally AdjustedPersonal consumption expenditures: Transportation services
Annual, Not Seasonally AdjustedPersonal consumption expenditures: Nondurable goods: Gasoline and other energy goods
Annual, Not Seasonally AdjustedReal Personal Consumption Expenditures
Annual, Not Seasonally Adjusted Quarterly, Not Seasonally Adjusted Quarterly, Seasonally Adjusted Annual Rate Index 2017=100, Quarterly, Not Seasonally Adjusted Percent Change from Preceding Period, Annual, Not Seasonally Adjusted Percent Change from Preceding Period, Monthly, Seasonally Adjusted Percent Change from Preceding Period, Quarterly, Seasonally Adjusted Annual Rate Percent Change from Quarter One Year Ago, Quarterly, Not Seasonally Adjusted Percent Change from Quarter One Year Ago, Quarterly, Seasonally AdjustedAll Sectors; Total Mortgages; Asset, Level
Annual, Not Seasonally AdjustedM2
Monthly, Not Seasonally Adjusted Weekly, Not Seasonally AdjustedCurrency Component of M1
Monthly, Not Seasonally Adjusted Weekly, Not Seasonally AdjustedRelated Categories
Gov't Receipts, Expenditures & Investment
National Income & Product Accounts
National Accounts
GDP/GNP
Personal Income & Outlays
Flow of Funds
Personal Consumption Expenditures
L.214 Loans
Population
Population, Employment, & Labor Markets
Federal Government Debt
Money Velocity
Monetary Data
Money, Banking, & Finance
M2 and Components
M1 and Components
Releases
More
Series from Gross Domestic Product
More
Series from Personal Income and Outlays
More
Series from Z.1 Financial Accounts of the United States
More
Series from Supplemental Estimates, Underlying Detail Tables
More
Series from National Population Estimates
More
Series from Treasury Bulletin
More
Series from Money Velocity
More
Series from H.6 Money Stock Measures
Tags
Expenditures
Federal
Government
National Income and Product Accounts
Bureau of Economic Analysis
Gross Domestic Product
Quarterly
Seasonally Adjusted
Nation
Public Domain: Citation Requested
United States of America
Not Seasonally Adjusted
Personal Consumption Expenditures
Consumption Expenditures
Consumption
Personal
Monthly
Nonfinancial
Capital
Transactions
Business
Z.1 US Financial Accounts
Board of Governors
Insurance
Financial
Services
Parts
Vehicles
Durable Goods
Goods
Production
Households
Housing
Food
Health
Transportation
Nondurable Goods
Energy
Gas
Headline Figure
Real
Mortgage
Sector
Assets
Population
Census
U.S. Treasury: Financial Management Service
Public
Debt
Velocity
M2 Money Stock
Monetary Aggregates
St. Louis Fed
Copyrighted: Citation Required
H.6 Money Stock Measures
M1 Money Stock
Currency