Notes
Source: Board of Governors of the Federal Reserve System (US)
Release: H.15 Selected Interest Rates
Units:
Frequency:
Notes:
Averages of daily figures.
For additional historical federal funds rate data, please see Daily Federal Funds Rate from 1928-1954.
The federal funds rate is the interest rate at which depository institutions trade federal funds (balances held at Federal Reserve Banks) with each other overnight. When a depository institution has surplus balances in its reserve account, it lends to other banks in need of larger balances. In simpler terms, a bank with excess cash, which is often referred to as liquidity, will lend to another bank that needs to quickly raise liquidity. (1) The rate that the borrowing institution pays to the lending institution is determined between the two banks; the weighted average rate for all of these types of negotiations is called the effective federal funds rate.(2) The effective federal funds rate is essentially determined by the market but is influenced by the Federal Reserve as it uses the Interest on Reserve Balances rate to steer the federal funds rate toward the target range.(2)
The Federal Open Market Committee (FOMC) meets eight times a year to determine the federal funds target range. The Fed's primary tool for influencing the federal funds rate is the interest the Fed pays on the funds that banks hold as reserve balances at their Federal Reserve Bank, which is the Interest on Reserves Balances (IORB) rate. Because banks are unlikely to lend funds in the federal funds market for less than they get paid in their reserve balance account at the Federal Reserve, the Interest on Reserve Balances (IORB) is an effective tool for guiding the federal funds rate. (3) Whether the Federal Reserve raises or lowers the target range for the federal funds rate depends on the state of the economy. If the FOMC believes the economy is growing too fast and inflation pressures are inconsistent with the dual mandate of the Federal Reserve, the Committee may temper economic activity by raising the target range for federal funds rate, and increasing the IORB rate to steer the federal funds rate into the target range. In the opposing scenario, the FOMC may spur greater economic activity by lowering the target range for federal funds rate, and decreasing the IORB rate to steer the federal funds rate into the target range. (3) Therefore, the FOMC must observe the current state of the economy to determine the best course of monetary policy that will maximize economic growth while adhering to the dual mandate set forth by Congress. In making its monetary policy decisions, the FOMC considers a wealth of economic data, such as: trends in prices and wages, employment, consumer spending and income, business investments, and foreign exchange markets.
The federal funds rate is the central interest rate in the U.S. financial market. It influences other interest rates such as the prime rate, which is the rate banks charge their customers with higher credit ratings. Additionally, the federal funds rate indirectly influences longer- term interest rates such as mortgages, loans, and savings, all of which are very important to consumer wealth and confidence.(2)
References
(1) Federal Reserve Bank of New York. "Federal funds." Fedpoints, August 2007.
(2) Monetary Policy, Board of Governors of the Federal Reserve System.
(3) The Fed Explained, Board of Governors of the Federal Reserve System
For further information, see The Fed's New Monetary Policy Tools, Page One Economics, Federal Reserve Bank of St. Louis.
For questions on the data, please contact the data source. For questions on FRED functionality, please contact us here.
Suggested Citation:
Board of Governors of the Federal Reserve System (US), Federal Funds Effective Rate [FEDFUNDS], retrieved from FRED, Federal Reserve Bank of St. Louis; https://fred.stlouisfed.org/series/FEDFUNDS, .
Source: U.S. Bureau of Labor Statistics
Release: Consumer Price Index
Units:
Frequency:
Notes:
The Consumer Price Index for All Urban Consumers: All Items (CPIAUCSL) is a price index of a basket of goods and services paid by urban consumers. Percent changes in the price index measure the inflation rate between any two time periods. The most common inflation metric is the percent change from one year ago. It can also represent the buying habits of urban consumers. This particular index includes roughly 88 percent of the total population, accounting for wage earners, clerical workers, technical workers, self-employed, short-term workers, unemployed, retirees, and those not in the labor force.
The CPIs are based on prices for food, clothing, shelter, and fuels; transportation fares; service fees (e.g., water and sewer service); and sales taxes. Prices are collected monthly from about 4,000 housing units and approximately 26,000 retail establishments across 87 urban areas. To calculate the index, price changes are averaged with weights representing their importance in the spending of the particular group. The index measures price changes (as a percent change) from a predetermined reference date. In addition to the original unadjusted index distributed, the Bureau of Labor Statistics also releases a seasonally adjusted index. The unadjusted series reflects all factors that may influence a change in prices. However, it can be very useful to look at the seasonally adjusted CPI, which removes the effects of seasonal changes, such as weather, school year, production cycles, and holidays.
The CPI can be used to recognize periods of inflation and deflation. Significant increases in the CPI within a short time frame might indicate a period of inflation, and significant decreases in CPI within a short time frame might indicate a period of deflation. However, because the CPI includes volatile food and oil prices, it might not be a reliable measure of inflationary and deflationary periods. For a more accurate detection, the core CPI (CPILFESL) is often used. When using the CPI, please note that it is not applicable to all consumers and should not be used to determine relative living costs. Additionally, the CPI is a statistical measure vulnerable to sampling error since it is based on a sample of prices and not the complete average.
For more information on the CPI, see the Handbook of Methods, the release notes and announcements, and the Frequently Asked Questions (FAQs).
Suggested Citation:
U.S. Bureau of Labor Statistics, Consumer Price Index for All Urban Consumers: All Items in U.S. City Average [CPIAUCSL], retrieved from FRED, Federal Reserve Bank of St. Louis; https://fred.stlouisfed.org/series/CPIAUCSL, .
Source: U.S. Bureau of Labor Statistics
Release: Employment Situation
Units:
Frequency:
Notes:
The unemployment rate represents the number of unemployed as a percentage of the labor force. Labor force data are restricted to people 16 years of age and older, who currently reside in 1 of the 50 states or the District of Columbia, who do not reside in institutions (e.g., penal and mental facilities, homes for the aged), and who are not on active duty in the Armed Forces.
This rate is also defined as the U-3 measure of labor underutilization.
The series comes from the 'Current Population Survey (Household Survey)'
The source code is: LNS14000000
Suggested Citation:
U.S. Bureau of Labor Statistics, Unemployment Rate [UNRATE], retrieved from FRED, Federal Reserve Bank of St. Louis; https://fred.stlouisfed.org/series/UNRATE, .
Source: Sahm, Claudia
Release: Sahm Rule Recession Indicator
Units:
Frequency:
Notes:
Sahm Recession Indicator signals the start of a recession when the three-month moving average of the national unemployment rate (U3) rises by 0.50 percentage points or more relative to the minimum of the three-month averages from the previous 12 months.
This indicator is based on "real-time" data, that is, the unemployment rate (and the recent history of unemployment rates) that were available in a given month. The BLS revises the unemployment rate each year at the beginning of January, when the December unemployment rate for the prior year is published. Revisions to the seasonal factors can affect estimates in recent years. Otherwise the unemployment rate does not revise.
Suggested Citation:
Sahm, Claudia, Real-time Sahm Rule Recession Indicator [SAHMREALTIME], retrieved from FRED, Federal Reserve Bank of St. Louis; https://fred.stlouisfed.org/series/SAHMREALTIME, .
Source: Federal Reserve Bank of St. Louis
Release: Recession Indicators Series
Units:
Frequency:
Notes:
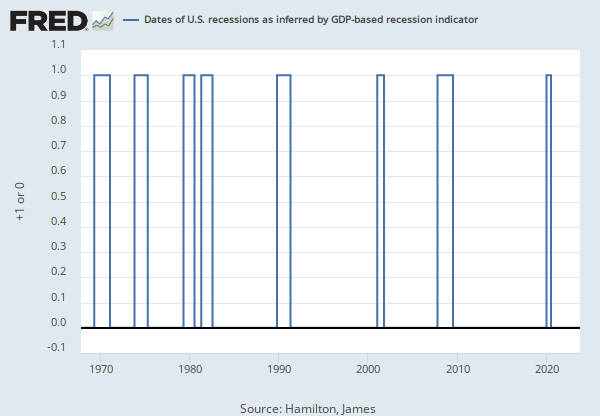
This time series is an interpretation of US Business Cycle Expansions and Contractions data provided by The National Bureau of Economic Research (NBER). Our time series is composed of dummy variables that represent periods of expansion and recession. The NBER identifies months and quarters of turning points without designating a date within the period that turning points occurred. The dummy variable adopts an arbitrary convention that the turning point occurred at a specific date within the period. The arbitrary convention does not reflect any judgment on this issue by the NBER's Business Cycle Dating Committee. A value of 1 is a recessionary period, while a value of 0 is an expansionary period. For this time series, the recession begins the first day of the period following a peak and ends on the last day of the period of the trough. For more options on recession shading, see the notes and links below.
The recession shading data that we provide initially comes from the source as a list of dates that are either an economic peak or trough. We interpret dates into recession shading data using one of three arbitrary methods. All of our recession shading data is available using all three interpretations. The period between a peak and trough is always shaded as a recession. The peak and trough are collectively extrema. Depending on the application, the extrema, both individually and collectively, may be included in the recession period in whole or in part. In situations where a portion of a period is included in the recession, the whole period is deemed to be included in the recession period.
The first interpretation, known as the midpoint method, is to show a recession from the midpoint of the peak through the midpoint of the trough for monthly and quarterly data. For daily data, the recession begins on the 15th of the month of the peak and ends on the 15th of the month of the trough. Daily data is a disaggregation of monthly data. For monthly and quarterly data, the entire peak and trough periods are included in the recession shading. This method shows the maximum number of periods as a recession for monthly and quarterly data. The Federal Reserve Bank of St. Louis uses this method in its own publications. One version of this time series is represented using the midpoint method The second interpretation, known as the trough method, is to show a recession from the period following the peak through the trough (i.e. the peak is not included in the recession shading, but the trough is). For daily data, the recession begins on the first day of the first month following the peak and ends on the last day of the month of the trough. Daily data is a disaggregation of monthly data. The trough method is used when displaying data on FRED graphs. The trough method is used for this series.
The third interpretation, known as the peak method, is to show a recession from the period of the peak to the trough (i.e. the peak is included in the recession shading, but the trough is not). For daily data, the recession begins on the first day of the month of the peak and ends on the last day of the month preceding the trough. Daily data is a disaggregation of monthly data. Here is an example of this time series represented using the peak method.
Suggested Citation:
Federal Reserve Bank of St. Louis, NBER based Recession Indicators for the United States from the Period following the Peak through the Trough [USREC], retrieved from FRED, Federal Reserve Bank of St. Louis; https://fred.stlouisfed.org/series/USREC, .
Release Tables
Consumer Price Index
Employment Situation
- Monthly, Seasonally Adjusted (population data is not adjusted for seasonal variation; not seasonally adjusted version used)
- Table A-10. Selected unemployment indicators, Seasonally adjusted: Monthly, Unemployment Rates
- Table A-15. Alternative measures of labor underutilization: Monthly, Seasonally Adjusted
H.15 Selected Interest Rates
Related Data and Content
Data Suggestions Based On Your Search


Content Suggestions


Other Formats
Federal Funds Effective Rate
Annual, Not Seasonally Adjusted Biweekly, Not Seasonally Adjusted Daily, Not Seasonally Adjusted Daily, Not Seasonally Adjusted Weekly, Not Seasonally AdjustedConsumer Price Index for All Urban Consumers: All Items in U.S. City Average
Monthly, Not Seasonally Adjusted Semiannual, Not Seasonally AdjustedUnemployment Rate
Monthly, Not Seasonally AdjustedNBER based Recession Indicators for the United States from the Period following the Peak through the Trough
Daily, Not Seasonally Adjusted Quarterly, Not Seasonally AdjustedRelated Categories
FRB Rates - discount, fed funds, primary credit
Interest Rates
Money, Banking, & Finance
Consumer Price Indexes (CPI and PCE)
Prices
Unemployment Rate
Current Population Survey (Household Survey)
Population, Employment, & Labor Markets
Recession Probabilities
Academic Data
Business Cycle Expansions & Contractions
Production & Business Activity
Releases
More
Series from H.15 Selected Interest Rates
More
Series from Consumer Price Index
More
Series from Employment Situation
More
Series from Sahm Rule Recession Indicator
More
Series from Recession Indicators Series
Tags
H.15 Selected Interest Rates
Federal
Interest Rate
Interest
Board of Governors
Rate
Monthly
Nation
Public Domain: Citation Requested
United States of America
Not Seasonally Adjusted
Headline Figure
Average
All Items
Urban
Consumer
Consumer Price Index
Inflation
Price Index
Indexes
Seasonally Adjusted
Price
Bureau of Labor Statistics
Labor Underutilization
Civilian
16 Years +
Current Population Survey (Household Survey)
Labor
Unemployment
Claudia Sahm
Recession Indicators
Academic Data
Peak
Trough
National Bureau of Economic Research
St. Louis Fed
Copyrighted: Citation Required