Notes
Source: Ice Data Indices, LLC
Release: ICE BofA Indices
Units:
Frequency:
Notes:
Starting in April 2026, this series will only include 3 years of observations. For more data, go to the source.
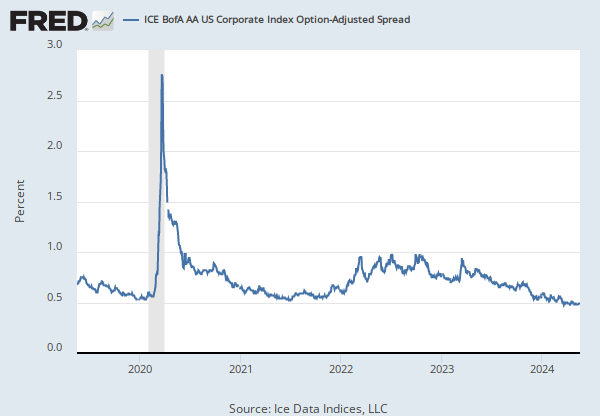
This data represents the Option-Adjusted Spread (OAS) of the ICE BofA US Corporate B Index, a subset of the ICE BofA US High Yield Master II Index tracking the performance of US dollar denominated below investment grade rated corporate debt publicly issued in the US domestic market. This subset includes all securities with a given investment grade rating B.
The ICE BofA OASs are the calculated spreads between a computed OAS index of all bonds in a given rating category and a spot Treasury curve. An OAS index is constructed using each constituent bond's OAS, weighted by market capitalization. When the last calendar day of the month takes place on the weekend, weekend observations will occur as a result of month ending accrued interest adjustments.
Certain indices and index data included in FRED are the property of ICE Data Indices, LLC (“ICE DATA”) and used under license. ICE® IS A REGISTERED TRADEMARK OF ICE DATA OR ITS AFFILIATES AND BOFA® IS A REGISTERED TRADEMARK OF BANK OF AMERICA CORPORATION LICENSED BY BANK OF AMERICA CORPORATION AND ITS AFFILIATES (“BOFA”) AND MAY NOT BE USED WITHOUT BOFA’S PRIOR WRITTEN APPROVAL. ICE DATA, ITS AFFILIATES AND THEIR RESPECTIVE THIRD PARTY SUPPLIERS DISCLAIM ANY AND ALL WARRANTIES AND REPRESENTATIONS, EXPRESS AND/OR IMPLIED, INCLUDING ANY WARRANTIES OF MERCHANTABILITY OR FITNESS FOR A PARTICULAR PURPOSE OR USE, INCLUDING WITH REGARD TO THE INDICES, INDEX DATA AND ANY DATA INCLUDED IN, RELATED TO, OR DERIVED THEREFROM. NEITHER ICE DATA, NOR ITS AFFILIATES OR THEIR RESPECTIVE THIRD PARTY PROVIDERS SHALL BE SUBJECT TO ANY DAMAGES OR LIABILITY WITH RESPECT TO THE ADEQUACY, ACCURACY, TIMELINESS OR COMPLETENESS OF THE INDICES OR THE INDEX DATA OR ANY COMPONENT THEREOF. THE INDICES AND INDEX DATA AND ALL COMPONENTS THEREOF ARE PROVIDED ON AN “AS IS” BASIS AND YOUR USE IS AT YOUR OWN RISK. ICE DATA, ITS AFFILIATES AND THEIR RESPECTIVE THIRD PARTY SUPPLIERS DO NOT SPONSOR, ENDORSE, OR RECOMMEND FRED, OR ANY OF ITS PRODUCTS OR SERVICES.
Copyright, 2023, ICE Data Indices. Reproduction of this data in any form is prohibited except with the prior written permission of ICE Data Indices.
The end of day Index values, Index returns, and Index statistics (“Top Level Data”) are being provided for your internal use only and you are not authorized or permitted to publish, distribute or otherwise furnish Top Level Data to any third-party without prior written approval of ICE Data.
Neither ICE Data, its affiliates nor any of its third party suppliers shall have any liability for the accuracy or completeness of the Top Level Data furnished through FRED, or for delays, interruptions or omissions therein nor for any lost profits, direct, indirect, special or consequential damages.
The Top Level Data is not investment advice and a reference to a particular investment or security, a credit rating or any observation concerning a security or investment provided in the Top Level Data is not a recommendation to buy, sell or hold such investment or security or make any other investment decisions.
You shall not use any Indices as a reference index for the purpose of creating financial products (including but not limited to any exchange-traded fund or other passive index-tracking fund, or any other financial instrument whose objective or return is linked in any way to any Index) without prior written approval of ICE Data.
ICE Data, their affiliates or their third party suppliers have exclusive proprietary rights in the Top Level Data and any information and software received in connection therewith.
You shall not use or permit anyone to use the Top Level Data for any unlawful or unauthorized purpose.
Access to the Top Level Data is subject to termination in the event that any agreement between FRED and ICE Data terminates for any reason.
ICE Data may enforce its rights against you as the third-party beneficiary of the FRED Services Terms of Use, even though ICE Data is not a party to the FRED Services Terms of Use.
The FRED Services Terms of Use, including but limited to the limitation of liability, indemnity and disclaimer provisions, shall extend to third party suppliers.
Suggested Citation:
Ice Data Indices, LLC, ICE BofA Single-B US High Yield Index Option-Adjusted Spread [BAMLH0A2HYB], retrieved from FRED, Federal Reserve Bank of St. Louis; https://fred.stlouisfed.org/series/BAMLH0A2HYB, .
Source: Federal Reserve Bank of St. Louis
Release: Interest Rate Spreads
Units:
Frequency:
Notes:
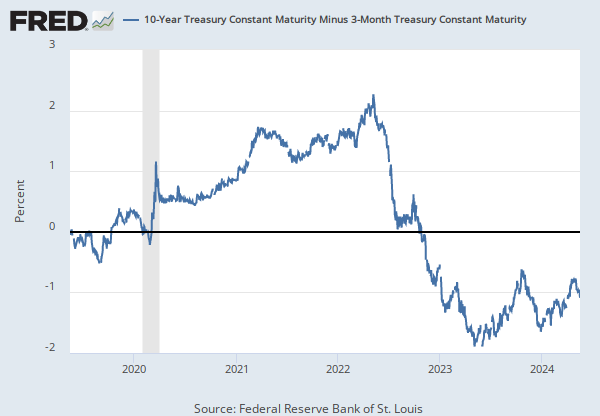
Series is calculated as the spread between 10-Year Treasury Constant Maturity (BC_10YEAR) and 3-Month Treasury Constant Maturity (BC_3MONTH).
Starting with the update on June 21, 2019, the Treasury bond data used in calculating interest rate spreads is obtained directly from the U.S. Treasury Department.
Suggested Citation:
Federal Reserve Bank of St. Louis, 10-Year Treasury Constant Maturity Minus 3-Month Treasury Constant Maturity [T10Y3M], retrieved from FRED, Federal Reserve Bank of St. Louis; https://fred.stlouisfed.org/series/T10Y3M, .
Source: Chicago Board Options Exchange
Release: CBOE Market Statistics
Units:
Frequency:
Notes:
VIX measures market expectation of near term volatility conveyed by stock index option prices. Copyright, 2016, Chicago Board Options Exchange, Inc. Reprinted with permission.
Suggested Citation:
Chicago Board Options Exchange, CBOE Volatility Index: VIX [VIXCLS], retrieved from FRED, Federal Reserve Bank of St. Louis; https://fred.stlouisfed.org/series/VIXCLS, .
Source: Board of Governors of the Federal Reserve System (US)
Release: Senior Loan Officer Opinion Survey on Bank Lending Practices
Units:
Frequency:
Notes:
This data series is part of the Board of Governors of the Federal Reserve System's Senior Loan Officer Opinion Survey on Bank Lending Practices (SLOOS). The purpose of the survey is to provide qualitative and limited quantitative information on bank credit availability and loan demand, as well as on evolving developments and lending practices in the U.S. loan markets. A portion of each survey typically covers special topics of timely interest.
For questions on the data, please contact the data source. For questions on FRED functionality, please contact us here.
Suggested Citation:
Board of Governors of the Federal Reserve System (US), Net Percentage of Domestic Banks Tightening Standards for Commercial and Industrial Loans to Large and Middle-Market Firms [DRTSCILM], retrieved from FRED, Federal Reserve Bank of St. Louis; https://fred.stlouisfed.org/series/DRTSCILM, .
Source: U.S. Federal Open Market Committee
Source: Federal Reserve Bank of St. Louis
Release: Summary of Economic Projections
Units:
Frequency:
Notes:
Projections of real gross domestic product growth are fourth-quarter growth rates, that is, percentage changes from the fourth quarter of the prior year to the fourth quarter of the indicated year. Each participant's projections are based on his or her assessment of appropriate monetary policy. The range for each variable in a given year includes all participants' projections, from lowest to highest, for that variable in the given year; the central tendencies exclude the three highest and three lowest projections for each year. This series represents the midpoint of the central tendency forecast's high and low values established by the Federal Open Market Committee.
Digitized originals of this release can be found at https://fraser.stlouisfed.org/publication/?pid=677.
Suggested Citation:
U.S. Federal Open Market Committee and Federal Reserve Bank of St. Louis, FOMC Summary of Economic Projections for the Growth Rate of Real Gross Domestic Product, Central Tendency, Midpoint [GDPC1CTM], retrieved from FRED, Federal Reserve Bank of St. Louis; https://fred.stlouisfed.org/series/GDPC1CTM, .
Source: Ice Data Indices, LLC
Release: ICE BofA Indices
Units:
Frequency:
Notes:
Starting in April 2026, this series will only include 3 years of observations. For more data, go to the source.
This data represents the Option-Adjusted Spread (OAS) of the ICE BofA BBB US Corporate Index, a subset of the ICE BofA US Corporate Master Index tracking the performance of US dollar denominated investment grade rated corporate debt publicly issued in the US domestic market. This subset includes all securities with a given investment grade rating BBB.
The ICE BofA OASs are the calculated spreads between a computed OAS index of all bonds in a given rating category and a spot Treasury curve. An OAS index is constructed using each constituent bond's OAS, weighted by market capitalization. When the last calendar day of the month takes place on the weekend, weekend observations will occur as a result of month ending accrued interest adjustments.
Certain indices and index data included in FRED are the property of ICE Data Indices, LLC (“ICE DATA”) and used under license. ICE® IS A REGISTERED TRADEMARK OF ICE DATA OR ITS AFFILIATES AND BOFA® IS A REGISTERED TRADEMARK OF BANK OF AMERICA CORPORATION LICENSED BY BANK OF AMERICA CORPORATION AND ITS AFFILIATES (“BOFA”) AND MAY NOT BE USED WITHOUT BOFA’S PRIOR WRITTEN APPROVAL. ICE DATA, ITS AFFILIATES AND THEIR RESPECTIVE THIRD PARTY SUPPLIERS DISCLAIM ANY AND ALL WARRANTIES AND REPRESENTATIONS, EXPRESS AND/OR IMPLIED, INCLUDING ANY WARRANTIES OF MERCHANTABILITY OR FITNESS FOR A PARTICULAR PURPOSE OR USE, INCLUDING WITH REGARD TO THE INDICES, INDEX DATA AND ANY DATA INCLUDED IN, RELATED TO, OR DERIVED THEREFROM. NEITHER ICE DATA, NOR ITS AFFILIATES OR THEIR RESPECTIVE THIRD PARTY PROVIDERS SHALL BE SUBJECT TO ANY DAMAGES OR LIABILITY WITH RESPECT TO THE ADEQUACY, ACCURACY, TIMELINESS OR COMPLETENESS OF THE INDICES OR THE INDEX DATA OR ANY COMPONENT THEREOF. THE INDICES AND INDEX DATA AND ALL COMPONENTS THEREOF ARE PROVIDED ON AN “AS IS” BASIS AND YOUR USE IS AT YOUR OWN RISK. ICE DATA, ITS AFFILIATES AND THEIR RESPECTIVE THIRD PARTY SUPPLIERS DO NOT SPONSOR, ENDORSE, OR RECOMMEND FRED, OR ANY OF ITS PRODUCTS OR SERVICES.
Copyright, 2023, ICE Data Indices. Reproduction of this data in any form is prohibited except with the prior written permission of ICE Data Indices.
The end of day Index values, Index returns, and Index statistics (“Top Level Data”) are being provided for your internal use only and you are not authorized or permitted to publish, distribute or otherwise furnish Top Level Data to any third-party without prior written approval of ICE Data.
Neither ICE Data, its affiliates nor any of its third party suppliers shall have any liability for the accuracy or completeness of the Top Level Data furnished through FRED, or for delays, interruptions or omissions therein nor for any lost profits, direct, indirect, special or consequential damages.
The Top Level Data is not investment advice and a reference to a particular investment or security, a credit rating or any observation concerning a security or investment provided in the Top Level Data is not a recommendation to buy, sell or hold such investment or security or make any other investment decisions.
You shall not use any Indices as a reference index for the purpose of creating financial products (including but not limited to any exchange-traded fund or other passive index-tracking fund, or any other financial instrument whose objective or return is linked in any way to any Index) without prior written approval of ICE Data.
ICE Data, their affiliates or their third party suppliers have exclusive proprietary rights in the Top Level Data and any information and software received in connection therewith.
You shall not use or permit anyone to use the Top Level Data for any unlawful or unauthorized purpose.
Access to the Top Level Data is subject to termination in the event that any agreement between FRED and ICE Data terminates for any reason.
ICE Data may enforce its rights against you as the third-party beneficiary of the FRED Services Terms of Use, even though ICE Data is not a party to the FRED Services Terms of Use.
The FRED Services Terms of Use, including but limited to the limitation of liability, indemnity and disclaimer provisions, shall extend to third party suppliers.
Suggested Citation:
Ice Data Indices, LLC, ICE BofA BBB US Corporate Index Option-Adjusted Spread [BAMLC0A4CBBB], retrieved from FRED, Federal Reserve Bank of St. Louis; https://fred.stlouisfed.org/series/BAMLC0A4CBBB, .
Source: Board of Governors of the Federal Reserve System (US)
Release: H.4.1 Factors Affecting Reserve Balances
Units:
Frequency:
Notes:
For questions on the data, please contact the data source. For questions on FRED functionality, please contact us here.
Suggested Citation:
Board of Governors of the Federal Reserve System (US), Assets: Total Assets: Total Assets (Less Eliminations from Consolidation): Wednesday Level [WALCL], retrieved from FRED, Federal Reserve Bank of St. Louis; https://fred.stlouisfed.org/series/WALCL, .
Source: Board of Governors of the Federal Reserve System (US)
Release: H.15 Selected Interest Rates
Units:
Frequency:
Notes:
For further information regarding treasury constant maturity data, please refer to the H.15 Statistical Release notes and the Treasury Yield Curve Methodology.
For questions on the data, please contact the data source. For questions on FRED functionality, please contact us here.
Suggested Citation:
Board of Governors of the Federal Reserve System (US), Market Yield on U.S. Treasury Securities at 10-Year Constant Maturity, Quoted on an Investment Basis, Inflation-Indexed [FII10], retrieved from FRED, Federal Reserve Bank of St. Louis; https://fred.stlouisfed.org/series/FII10, .
Source: Haver Analytics
Source: Dow Jones & Company
Release: Daily Treasury Inflation-Indexed Securities
Units:
Frequency:
Notes:
Yield to maturity on accrued principal.
Treasury Inflation-Protected Securities, or TIPS, are securities whose principal is tied to the Consumer Price Index (CPI). The principal increases with inflation and decreases with deflation. When the security matures, the U.S. Treasury pays the original or adjusted principal, whichever is greater.
Copyright, 2016, Haver Analytics. Reprinted with permission.
Suggested Citation:
Haver Analytics and Dow Jones & Company, 5-Year 0-1/8% Treasury Inflation-Indexed Note, Due 4/15/2022 (DISCONTINUED) [DTP5A22], retrieved from FRED, Federal Reserve Bank of St. Louis; https://fred.stlouisfed.org/series/DTP5A22, .
Source: Organization for Economic Co-operation and Development
Release: Main Economic Indicators
Units:
Frequency:
Notes:
OECD Data Filters:
REF_AREA: CHN
MEASURE: RS
UNIT_MEASURE: IX
ACTIVITY: _Z
ADJUSTMENT: NOR
TRANSFORMATION: IX
TIME_HORIZ: _Z
METHODOLOGY: H
FREQ: M
All OECD data should be cited as follows: OECD (year), (dataset name), (data source) DOI or https://data-explorer.oecd.org/. (accessed on (date)).
Suggested Citation:
Organization for Economic Co-operation and Development, Composite Leading Indicators: Reference Series (GDP) Normalized for China [CHNLORSGPNOSTSAM], retrieved from FRED, Federal Reserve Bank of St. Louis; https://fred.stlouisfed.org/series/CHNLORSGPNOSTSAM, .
Source: Federal Reserve Bank of St. Louis
Release: Recession Indicators Series
Units:
Frequency:
Notes:
This time series is an interpretation of Organisation of Economic Development (OECD) Composite Leading Indicators: Reference Turning Points and Component Series data, which can be found at http://www.oecd.org/std/leading-indicators/oecdcompositeleadingindicatorsreferenceturningpointsandcomponentseries.htm. The OECD identifies months of turning points without designating a date within the month that turning points occurred. The dummy variable adopts an arbitrary convention that the turning point occurred at a specific date within the month. The arbitrary convention does not reflect any judgment on this issue by the OECD. Our time series is composed of dummy variables that represent periods of expansion and recession. A value of 1 is a recessionary period, while a value of 0 is an expansionary period. For this time series, the recession begins the first day of the period of the peak and ends on the last day of the period before the trough. For more options on recession shading, see the notes and links below.
The recession shading data that we provide initially comes from the source as a list of dates that are either an economic peak or trough. We interpret dates into recession shading data using one of three arbitrary methods. All of our recession shading data is available using all three interpretations. The period between a peak and trough is always shaded as a recession. The peak and trough are collectively extrema. Depending on the application, the extrema, both individually and collectively, may be included in the recession period in whole or in part. In situations where a portion of a period is included in the recession, the whole period is deemed to be included in the recession period.
The first interpretation, known as the midpoint method, is to show a recession from the midpoint of the peak through the midpoint of the trough for monthly and quarterly data. For daily data, the recession begins on the 15th of the month of the peak and ends on the 15th of the month of the trough. Daily data is a disaggregation of monthly data. For monthly and quarterly data, the entire peak and trough periods are included in the recession shading. This method shows the maximum number of periods as a recession for monthly and quarterly data. The Federal Reserve Bank of St. Louis uses this method in its own publications. A version of this time series represented using the midpoint method can be found at:
https://fred.stlouisfed.org/series/CHNRECDM
The second interpretation, known as the trough method, is to show a recession from the period following the peak through the trough (i.e. the peak is not included in the recession shading, but the trough is). For daily data, the recession begins on the first day of the first month following the peak and ends on the last day of the month of the trough. Daily data is a disaggregation of monthly data. The trough method is used when displaying data on FRED graphs. A version of this time series represented using the trough method can be found at:
https://fred.stlouisfed.org/series/CHNRECD
The third interpretation, known as the peak method, is to show a recession from the period of the peak to the trough (i.e. the peak is included in the recession shading, but the trough is not). For daily data, the recession begins on the first day of the month of the peak and ends on the last day of the month preceding the trough. Daily data is a disaggregation of monthly data. The peak method is used for this series.
The OECD CLI system is based on the "growth cycle" approach, where business cycles and turning points are measured and identified in the deviation-from-trend series. The main reference series used in the OECD CLI system for the majority of countries is industrial production (IIP) covering all industry sectors excluding construction. This series is used because of its cyclical sensitivity and monthly availability, while the broad based Gross Domestic Product (GDP) is used to supplement the IIP series for identification of the final reference turning points in the growth cycle.
Zones aggregates of the CLIs and the reference series are calculated as weighted averages of the corresponding zone member series (i.e. CLIs and IIPs).
Up to December 2008 the turning points chronologies shown for regional/zone area aggregates or individual countries are determined by the rules established by the National Bureau of Economic Research (NBER) in the United States, which have been formalized and incorporated in a computer routine (Bry and Boschan) and included in the Phase-Average Trend (PAT) de-trending procedure. Starting from December 2008 the turning point detection algorithm is decoupled from the de-trending procedure, and is a simplified version of the original Bry and Boschan routine. (The routine parses local minima and maxima in the cycle series and applies censor rules to guarantee alternating peaks and troughs, as well as phase and cycle length constraints.)
The components of the CLI are time series which exhibit leading relationship with the reference series (IIP) at turning points. Country CLIs are compiled by combining de-trended smoothed and normalized components. The component series for each country are selected based on various criteria such as economic significance; cyclical behavior; data quality; timeliness and availability.
OECD data should be cited as follows: OECD Composite Leading Indicators, "Composite Leading Indicators: Reference Turning Points and Component Series", http://www.oecd.org/std/leading-indicators/oecdcompositeleadingindicatorsreferenceturningpointsandcomponentseries.htm (Accessed on date)
Suggested Citation:
Federal Reserve Bank of St. Louis, OECD based Recession Indicators for China from the Peak through the Period preceding the Trough (DISCONTINUED) [CHNRECDP], retrieved from FRED, Federal Reserve Bank of St. Louis; https://fred.stlouisfed.org/series/CHNRECDP, .
Source: Federal Reserve Bank of St. Louis
Release: Recession Indicators Series
Units:
Frequency:
Notes:
This time series is an interpretation of Organisation of Economic Development (OECD) Composite Leading Indicators: Reference Turning Points and Component Series data, which can be found at http://www.oecd.org/std/leading-indicators/oecdcompositeleadingindicatorsreferenceturningpointsandcomponentseries.htm. The OECD identifies months of turning points without designating a date within the month that turning points occurred. The dummy variable adopts an arbitrary convention that the turning point occurred at a specific date within the month. The arbitrary convention does not reflect any judgment on this issue by the OECD. Our time series is composed of dummy variables that represent periods of expansion and recession. A value of 1 is a recessionary period, while a value of 0 is an expansionary period. For this time series, the recession begins midpoint of the period of the peak and ends midpoint of the period of the trough. Therefore, the recession period includes the entire period of both peak and trough. For more options on recession shading, see the notes and links below.
The recession shading data that we provide initially comes from the source as a list of dates that are either an economic peak or trough. We interpret dates into recession shading data using one of three arbitrary methods. All of our recession shading data is available using all three interpretations. The period between a peak and trough is always shaded as a recession. The peak and trough are collectively extrema. Depending on the application, the extrema, both individually and collectively, may be included in the recession period in whole or in part. In situations where a portion of a period is included in the recession, the whole period is deemed to be included in the recession period.
The first interpretation, known as the midpoint method, is to show a recession from the midpoint of the peak through the midpoint of the trough for monthly and quarterly data. For daily data, the recession begins on the 15th of the month of the peak and ends on the 15th of the month of the trough. Daily data is a disaggregation of monthly data. For monthly and quarterly data, the entire peak and trough periods are included in the recession shading. This method shows the maximum number of periods as a recession for monthly and quarterly data. The Federal Reserve Bank of St. Louis uses this method in its own publications. The midpoint method is used for this series.
The second interpretation, known as the trough method, is to show a recession from the period following the peak through the trough (i.e. the peak is not included in the recession shading, but the trough is). For daily data, the recession begins on the first day of the first month following the peak and ends on the last day of the month of the trough. Daily data is a disaggregation of monthly data. The trough method is used when displaying data on FRED graphs. A version of this time series represented using the trough method can be found at:
https://fred.stlouisfed.org/series/4BIGEUROREC
The third interpretation, known as the peak method, is to show a recession from the period of the peak to the trough (i.e. the peak is included in the recession shading, but the trough is not). For daily data, the recession begins on the first day of the month of the peak and ends on the last day of the month preceding the trough. Daily data is a disaggregation of monthly data. A version of this time series represented using the peak method can be found at:
https://fred.stlouisfed.org/series/4BIGEURORECP
The OECD CLI system is based on the "growth cycle" approach, where business cycles and turning points are measured and identified in the deviation-from-trend series. The main reference series used in the OECD CLI system for the majority of countries is industrial production (IIP) covering all industry sectors excluding construction. This series is used because of its cyclical sensitivity and monthly availability, while the broad based Gross Domestic Product (GDP) is used to supplement the IIP series for identification of the final reference turning points in the growth cycle.
Zones aggregates of the CLIs and the reference series are calculated as weighted averages of the corresponding zone member series (i.e. CLIs and IIPs).
Up to December 2008 the turning points chronologies shown for regional/zone area aggregates or individual countries are determined by the rules established by the National Bureau of Economic Research (NBER) in the United States, which have been formalized and incorporated in a computer routine (Bry and Boschan) and included in the Phase-Average Trend (PAT) de-trending procedure. Starting from December 2008 the turning point detection algorithm is decoupled from the de-trending procedure, and is a simplified version of the original Bry and Boschan routine. (The routine parses local minima and maxima in the cycle series and applies censor rules to guarantee alternating peaks and troughs, as well as phase and cycle length constraints.)
The components of the CLI are time series which exhibit leading relationship with the reference series (IIP) at turning points. Country CLIs are compiled by combining de-trended smoothed and normalized components. The component series for each country are selected based on various criteria such as economic significance; cyclical behavior; data quality; timeliness and availability.
The Four Big European Countries are: France, Germany, Italy, and United Kingdom.
OECD data should be cited as follows: OECD Composite Leading Indicators, "Composite Leading Indicators: Reference Turning Points and Component Series", http://www.oecd.org/std/leading-indicators/oecdcompositeleadingindicatorsreferenceturningpointsandcomponentseries.htm (Accessed on date)
Suggested Citation:
Federal Reserve Bank of St. Louis, OECD based Recession Indicators for Four Big European Countries from the Peak through the Trough (DISCONTINUED) [4BIGEURORECM], retrieved from FRED, Federal Reserve Bank of St. Louis; https://fred.stlouisfed.org/series/4BIGEURORECM, .
Release Tables
H.15 Selected Interest Rates
H.4.1 Factors Affecting Reserve Balances
Main Economic Indicators
Summary of Economic Projections
Related Data and Content
Data Suggestions Based On Your Search


Content Suggestions


Other Formats
10-Year Treasury Constant Maturity Minus 3-Month Treasury Constant Maturity
Monthly, Not Seasonally AdjustedMarket Yield on U.S. Treasury Securities at 10-Year Constant Maturity, Quoted on an Investment Basis, Inflation-Indexed
Annual, Not Seasonally Adjusted Daily, Not Seasonally Adjusted Weekly, Not Seasonally AdjustedOECD based Recession Indicators for China from the Peak through the Period preceding the Trough (DISCONTINUED)
Monthly, Not Seasonally AdjustedOECD based Recession Indicators for Four Big European Countries from the Peak through the Trough (DISCONTINUED)
Daily, Not Seasonally AdjustedRelated Categories
Corporate Bonds
Interest Rates
Money, Banking, & Finance
Interest Rate Spreads
Volatility Indexes
Financial Indicators
Senior Loan Officer Survey
Banking
GDP/GNP
National Income & Product Accounts
National Accounts
Factors Affecting Reserve Balances
Monetary Data
Treasury Inflation-Indexed Securities
Treasury Constant Maturity
China
Countries
International Data
Business Cycle Expansions & Contractions
Production & Business Activity
Four Big European Countries
Institutions
Releases
More
Series from ICE BofA Indices
More
Series from Interest Rate Spreads
More
Series from CBOE Market Statistics
More
Series from Senior Loan Officer Opinion Survey on Bank Lending Practices
More
Series from Summary of Economic Projections
More
Series from H.4.1 Factors Affecting Reserve Balances
More
Series from H.15 Selected Interest Rates
More
Series from Daily Treasury Inflation-Indexed Securities
More
Series from Main Economic Indicators
More
Series from Recession Indicators Series
Tags
Single B Bond Rating
Option-Adjusted Spread
BofA Merrill Lynch
BofA Merrill Lynch
Ice Data Indices, Llc
Yield
Copyrighted: Pre-Approval Required
Interest Rate
Interest
Daily
Rate
Nation
United States of America
Not Seasonally Adjusted
Yield Curve
Spread
3-Month
10-Year
Maturity
Treasury
St. Louis Fed
Copyrighted: Citation Required
Volatility Index
Chicago Board Options Exchange
Volatility
Stock Market
Tightening Standards
Senior Loan Officer Surv. on Bank Lending
Commercial
Domestic
Net
Loans
Percent
Industry
Board of Governors
Quarterly
Public Domain: Citation Requested
Federal Open Market Committee
Federal Open Markets Committee
Projection
Real
Gross Domestic Product
Annual
BBB Bond Rating
Corporate
H.4.1 Factors Affecting Reserve Balances
Weekly
Assets
Banks
Depository Institutions
Treasury Inflation-Indexes Securities (TIPS)
H.15 Selected Interest Rates
Securities
Monthly
New York Times
Haver Analytics
Dow Jones & Company
Fees
Notes
5-Year
Discontinued
Leading Indicator
China
Org. for Economic Co-operation and Development
Seasonally Adjusted
Peak
Trough
Recession Indicators
Four Big European Countries
Transnational