Notes
Source: Federal Reserve Bank of Philadelphia
Release: State Leading Indexes
Units:
Frequency:
Notes:
The leading index for each state predicts the six-month growth rate of the state's coincident index. In addition to the coincident index, the models include other variables that lead the economy: state-level housing permits (1 to 4 units), state initial unemployment insurance claims, delivery times from the Institute for Supply Management (ISM) manufacturing survey, and the interest rate spread between the 10-year Treasury bond and the 3-month Treasury bill.
Suggested Citation:
Federal Reserve Bank of Philadelphia, Leading Index for the United States [USSLIND], retrieved from FRED, Federal Reserve Bank of St. Louis; https://fred.stlouisfed.org/series/USSLIND, .
Source: Nasdaq, Inc.
Release: Nasdaq Daily Index Data
Units:
Frequency:
Notes:
The observations for the NASDAQ Composite Index represent the daily index value at market close. The market typically closes at 4 PM ET, except for holidays when it sometimes closes early.
The NASDAQ Composite Index is a market capitalization weighted index with more than 3000 common equities listed on the NASDAQ Stock Market. The types of securities in the index include American depositary receipts (ADRs), common stocks, real estate investment trusts (REITs), and tracking stocks. The index includes all NASDAQ listed stocks that are not derivatives, preferred shares, funds, exchange-traded funds (ETFs) or debentures.
Copyright © 2016, NASDAQ OMX Group, Inc.
Suggested Citation:
Nasdaq, Inc., NASDAQ Composite [NASDAQCOM], retrieved from FRED, Federal Reserve Bank of St. Louis; https://fred.stlouisfed.org/series/NASDAQCOM, .
Source: Federal Reserve Bank of St. Louis
Release: Interest Rate Spreads
Units:
Frequency:
Notes:
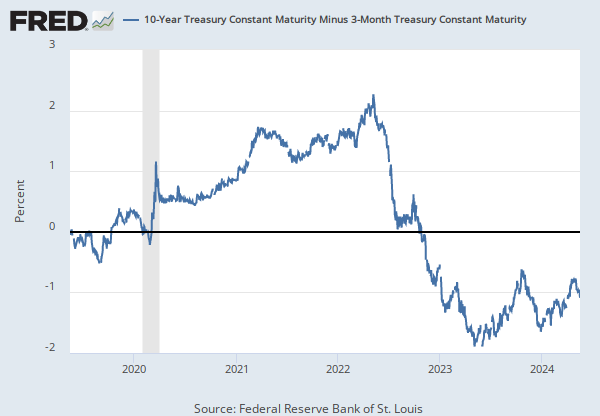
Starting with the update on June 21, 2019, the Treasury bond data used in calculating interest rate spreads is obtained directly from the U.S. Treasury Department.
Series is calculated as the spread between 10-Year Treasury Constant Maturity (BC_10YEAR) and 2-Year Treasury Constant Maturity (BC_2YEAR). Both underlying series are published at the U.S. Treasury Department.
Suggested Citation:
Federal Reserve Bank of St. Louis, 10-Year Treasury Constant Maturity Minus 2-Year Treasury Constant Maturity [T10Y2Y], retrieved from FRED, Federal Reserve Bank of St. Louis; https://fred.stlouisfed.org/series/T10Y2Y, .
Source: Board of Governors of the Federal Reserve System (US)
Release: H.4.1 Factors Affecting Reserve Balances (data not included in press release)
Units:
Frequency:
Notes:
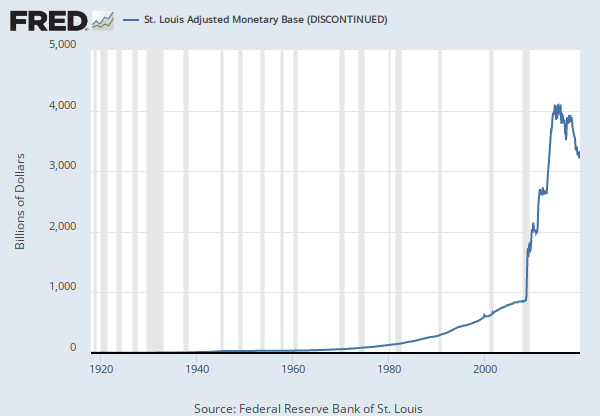
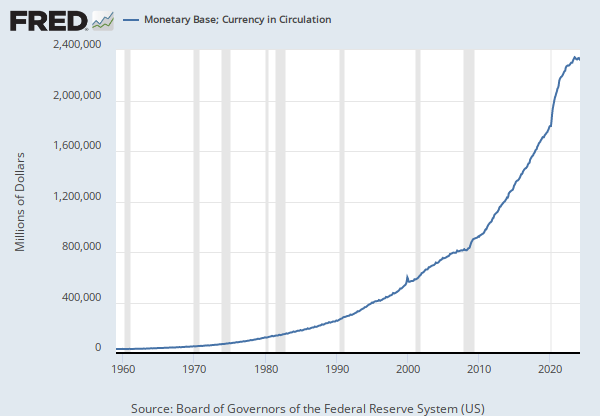
This series has been discontinued and will no longer be updated. The weekly version of this monthly series is WCURCIR.####
Suggested Citation:
Board of Governors of the Federal Reserve System (US), Currency in Circulation (DISCONTINUED) [CURRCIR], retrieved from FRED, Federal Reserve Bank of St. Louis; https://fred.stlouisfed.org/series/CURRCIR, .
Source: Board of Governors of the Federal Reserve System (US)
Release: Senior Loan Officer Opinion Survey on Bank Lending Practices
Units:
Frequency:
Notes:
This data series is part of the Board of Governors of the Federal Reserve System's Senior Loan Officer Opinion Survey on Bank Lending Practices (SLOOS). The purpose of the survey is to provide qualitative and limited quantitative information on bank credit availability and loan demand, as well as on evolving developments and lending practices in the U.S. loan markets. A portion of each survey typically covers special topics of timely interest.
For questions on the data, please contact the data source. For questions on FRED functionality, please contact us here.
Suggested Citation:
Board of Governors of the Federal Reserve System (US), Net Percentage of Domestic Banks Tightening Standards for Commercial and Industrial Loans to Large and Middle-Market Firms [DRTSCILM], retrieved from FRED, Federal Reserve Bank of St. Louis; https://fred.stlouisfed.org/series/DRTSCILM, .
Source: Board of Governors of the Federal Reserve System (US)
Release: H.4.1 Factors Affecting Reserve Balances
Units:
Frequency:
Notes:
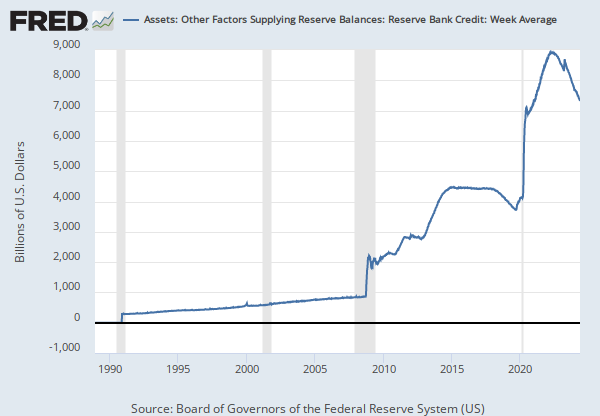
For questions on the data, please contact the data source. For questions on FRED functionality, please contact us here.
Suggested Citation:
Board of Governors of the Federal Reserve System (US), Liabilities and Capital: Other Factors Draining Reserve Balances: Currency in Circulation: Week Average [WCURCIR], retrieved from FRED, Federal Reserve Bank of St. Louis; https://fred.stlouisfed.org/series/WCURCIR, .
Source: U.S. Bureau of Labor Statistics
Release: Employment Situation
Units:
Frequency:
Notes:
Average weekly hours relate to the average hours per worker for which pay was received and is different from standard or scheduled hours. Factors such as unpaid absenteeism, labor turnover, part-time work, and stoppages cause average weekly hours to be lower than scheduled hours of work for an establishment. Group averages further reflect changes in the workweek of component industries. Average weekly hours are the total weekly hours divided by the employees paid for those hours.
Production and related employees include working supervisors and all nonsupervisory employees (including group leaders and trainees) engaged in fabricating, processing, assembling, inspecting, receiving, storing, handling, packing, warehousing, shipping, trucking, hauling, maintenance, repair, janitorial, guard services, product development, auxiliary production for plant's own use (for example, power plant), recordkeeping, and other services closely associated with the above production operations.
Nonsupervisory employees include those individuals in private, service-providing industries who are not above the working-supervisor level. This group includes individuals such as office and clerical workers, repairers, salespersons, operators, drivers, physicians, lawyers, accountants, nurses, social workers, research aides, teachers, drafters, photographers, beauticians, musicians, restaurant workers, custodial workers, attendants, line installers and repairers, laborers, janitors, guards, and other employees at similar occupational levels whose services are closely associated with those of the employees listed.
The series comes from the 'Current Employment Statistics (Establishment Survey).'
The source code is: CES3000000007
Suggested Citation:
U.S. Bureau of Labor Statistics, Average Weekly Hours of Production and Nonsupervisory Employees, Manufacturing [AWHMAN], retrieved from FRED, Federal Reserve Bank of St. Louis; https://fred.stlouisfed.org/series/AWHMAN, .
Source: Board of Governors of the Federal Reserve System (US)
Release: Senior Loan Officer Opinion Survey on Bank Lending Practices
Units:
Frequency:
Notes:
This data series is part of the Board of Governors of the Federal Reserve System's Senior Loan Officer Opinion Survey on Bank Lending Practices (SLOOS). The purpose of the survey is to provide qualitative and limited quantitative information on bank credit availability and loan demand, as well as on evolving developments and lending practices in the U.S. loan markets. A portion of each survey typically covers special topics of timely interest.
For questions on the data, please contact the data source. For questions on FRED functionality, please contact us here.
Suggested Citation:
Board of Governors of the Federal Reserve System (US), Net Percentage of Domestic Banks Reporting Stronger Demand for Qualified Mortgage Jumbo Mortgage Loans [SUBLPDHMDJNQ], retrieved from FRED, Federal Reserve Bank of St. Louis; https://fred.stlouisfed.org/series/SUBLPDHMDJNQ, .
Source: Organization for Economic Co-operation and Development
Release: Main Economic Indicators
Units:
Frequency:
Notes:
OECD Data Filters:
REF_AREA: USA
MEASURE: LI
UNIT_MEASURE: IX
ACTIVITY: _Z
ADJUSTMENT: NOR
TRANSFORMATION: IX
TIME_HORIZ: _Z
METHODOLOGY: H
FREQ: M
All OECD data should be cited as follows: OECD (year), (dataset name), (data source) DOI or https://data-explorer.oecd.org/. (accessed on (date)).
Suggested Citation:
Organization for Economic Co-operation and Development, Composite Leading Indicators: Composite Leading Indicator (CLI) Normalized for United States [USALOLITONOSTSAM], retrieved from FRED, Federal Reserve Bank of St. Louis; https://fred.stlouisfed.org/series/USALOLITONOSTSAM, .
Source: Federal Reserve Bank of Chicago
Release: Chicago Fed National Financial Conditions Index
Units:
Frequency:
Notes:
The Chicago Fed’s National Financial Conditions Index (NFCI) provides a comprehensive weekly update on U.S. financial conditions in money markets, debt and equity markets and the traditional and “shadow” banking systems. Positive values of the NFCI indicate financial conditions that are tighter than average, while negative values indicate financial conditions that are looser than average.
The adjusted NFCI (ANFCI). This index isolates a component of financial conditions uncorrelated with economic conditions to provide an update on how financial conditions compare with current economic conditions.
For further information, please visit the Federal Reserve Bank of Chicago's web site: http://www.chicagofed.org/webpages/publications/nfci/index.cfm
Suggested Citation:
Federal Reserve Bank of Chicago, Chicago Fed Adjusted National Financial Conditions Index [ANFCI], retrieved from FRED, Federal Reserve Bank of St. Louis; https://fred.stlouisfed.org/series/ANFCI, .
Source: Chauvet, Marcelle
Source: Piger, Jeremy Max
Release: U.S. Recession Probabilities
Units:
Frequency:
Notes:
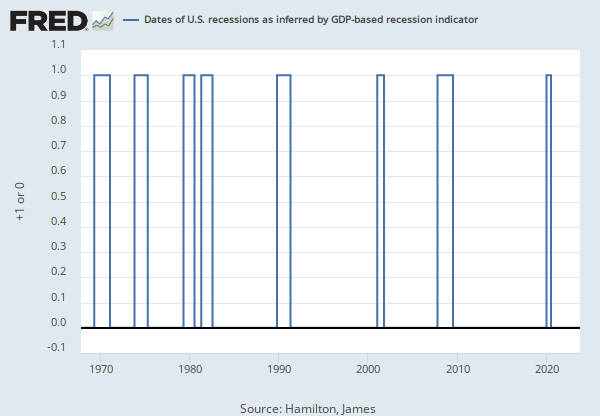
Smoothed recession probabilities for the United States are obtained from a dynamic-factor markov-switching model applied to four monthly coincident variables: non-farm payroll employment, the index of industrial production, real personal income excluding transfer payments, and real manufacturing and trade sales. This model was originally developed in Chauvet, M., "An Economic Characterization of Business Cycle Dynamics with Factor Structure and Regime Switching," International Economic Review, 1998, 39, 969-996.
For additional details, including an analysis of the performance of this model for dating business cycles in real time, see:
Chauvet, M. and J. Piger, "A Comparison of the Real-Time Performance of Business Cycle Dating Methods," Journal of Business and Economic Statistics, 2008, 26, 42-49.
For additional details as to why this data revises, see FAQ 3.
Suggested Citation:
Chauvet, Marcelle and Piger, Jeremy Max, Smoothed U.S. Recession Probabilities [RECPROUSM156N], retrieved from FRED, Federal Reserve Bank of St. Louis; https://fred.stlouisfed.org/series/RECPROUSM156N, .
Source: Chicago Board Options Exchange
Release: CBOE Market Statistics
Units:
Frequency:
Notes:
VIX measures market expectation of near term volatility conveyed by stock index option prices. Copyright, 2016, Chicago Board Options Exchange, Inc. Reprinted with permission.
Suggested Citation:
Chicago Board Options Exchange, CBOE Volatility Index: VIX [VIXCLS], retrieved from FRED, Federal Reserve Bank of St. Louis; https://fred.stlouisfed.org/series/VIXCLS, .
Release Tables
Employment Situation
H.4.1 Factors Affecting Reserve Balances
Main Economic Indicators
State Leading Indexes
Related Data and Content
Data Suggestions Based On Your Search


Content Suggestions


Other Formats
10-Year Treasury Constant Maturity Minus 2-Year Treasury Constant Maturity
Monthly, Not Seasonally AdjustedAverage Weekly Hours of Production and Nonsupervisory Employees, Manufacturing
Monthly, Not Seasonally AdjustedRelated Categories
Business Cycle Expansions & Contractions
Production & Business Activity
Financial Activity Measures
Financial Indicators
Money, Banking, & Finance
Stock Market Indexes
Interest Rate Spreads
Interest Rates
Factors Affecting Reserve Balances
Monetary Data
Senior Loan Officer Survey
Banking
Manufacturing
Current Employment Statistics (Establishment Survey)
Population, Employment, & Labor Markets
United States
Countries
International Data
Recession Probabilities
Academic Data
Volatility Indexes
Releases
More
Series from State Leading Indexes
More
Series from Nasdaq Daily Index Data
More
Series from Interest Rate Spreads
More
Series from H.4.1 Factors Affecting Reserve Balances (data not included in press release)
More
Series from Senior Loan Officer Opinion Survey on Bank Lending Practices
More
Series from H.4.1 Factors Affecting Reserve Balances
More
Series from Employment Situation
More
Series from Main Economic Indicators
More
Series from Chicago Fed National Financial Conditions Index
More
Series from U.S. Recession Probabilities
More
Series from CBOE Market Statistics
Tags
Leading Index
Philadelphia Fed
Headline Figure
Seasonally Adjusted
Copyrighted: Citation Required
Monthly
Nation
United States of America
Composite
Stock Market
National Association of Securities Dealers Automated Quotations
Nasdaq, Inc.
Copyrighted: Pre-Approval Required
Daily
Indexes
Not Seasonally Adjusted
2-Year
Yield Curve
Spread
10-Year
Maturity
Treasury
Interest Rate
Interest
St. Louis Fed
Rate
H.4.1 Factors Affecting Reserve Balances
Currency
Discontinued
Board of Governors
Public Domain: Citation Requested
Tightening Standards
Senior Loan Officer Surv. on Bank Lending
Commercial
Domestic
Net
Loans
Percent
Industry
Quarterly
Coins
Weekly
Nonsupervisory
Current Employment Statistics Survey (Establishment Survey)
Hours
Production
Manufacturing
Employment
Bureau of Labor Statistics
Jumbo
Mortgage
Banks
Depository Institutions
Leading Indicator
Org. for Economic Co-operation and Development
Chicago Fed National Financial Conditions Index
Chicago Fed
Adjusted
Financial
Chauvet, Marcelle
Marcelle M. Chauvet and Jeremy Piger
Recession Indicators
Academic Data
Volatility Index
Chicago Board Options Exchange
Volatility