Notes
Source: Nasdaq, Inc.
Release: Nasdaq Daily Index Data
Units:
Frequency:
Notes:
The observations for the NASDAQ Composite Index represent the daily index value at market close. The market typically closes at 4 PM ET, except for holidays when it sometimes closes early.
The NASDAQ Composite Index is a market capitalization weighted index with more than 3000 common equities listed on the NASDAQ Stock Market. The types of securities in the index include American depositary receipts (ADRs), common stocks, real estate investment trusts (REITs), and tracking stocks. The index includes all NASDAQ listed stocks that are not derivatives, preferred shares, funds, exchange-traded funds (ETFs) or debentures.
Copyright © 2016, NASDAQ OMX Group, Inc.
Suggested Citation:
Nasdaq, Inc., NASDAQ Composite [NASDAQCOM], retrieved from FRED, Federal Reserve Bank of St. Louis; https://fred.stlouisfed.org/series/NASDAQCOM, .
Source: Board of Governors of the Federal Reserve System (US)
Release: H.4.1 Factors Affecting Reserve Balances
Units:
Frequency:
Notes:
For questions on the data, please contact the data source. For questions on FRED functionality, please contact us here.
Suggested Citation:
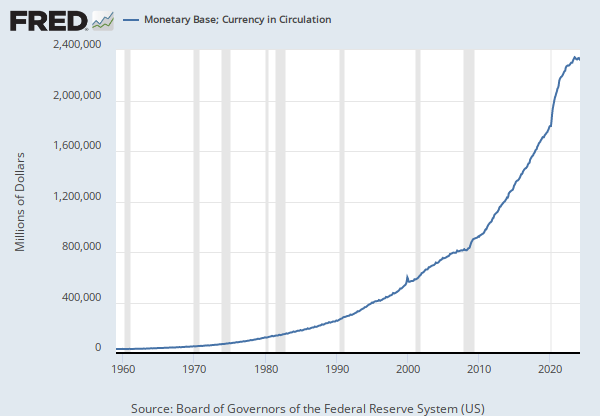
Board of Governors of the Federal Reserve System (US), Liabilities and Capital: Other Factors Draining Reserve Balances: Currency in Circulation: Week Average [WCURCIR], retrieved from FRED, Federal Reserve Bank of St. Louis; https://fred.stlouisfed.org/series/WCURCIR, .
Source: Federal Reserve Bank of Chicago
Release: Chicago Fed National Financial Conditions Index
Units:
Frequency:
Notes:
The Chicago Fed’s National Financial Conditions Index (NFCI) provides a comprehensive weekly update on U.S. financial conditions in money markets, debt and equity markets and the traditional and “shadow” banking systems. Positive values of the NFCI indicate financial conditions that are tighter than average, while negative values indicate financial conditions that are looser than average.
The adjusted NFCI (ANFCI). This index isolates a component of financial conditions uncorrelated with economic conditions to provide an update on how financial conditions compare with current economic conditions.
For further information, please visit the Federal Reserve Bank of Chicago's web site: http://www.chicagofed.org/webpages/publications/nfci/index.cfm
Suggested Citation:
Federal Reserve Bank of Chicago, Chicago Fed Adjusted National Financial Conditions Index [ANFCI], retrieved from FRED, Federal Reserve Bank of St. Louis; https://fred.stlouisfed.org/series/ANFCI, .
Source: Federal Reserve Bank of St. Louis
Release: Interest Rate Spreads
Units:
Frequency:
Notes:
Series is calculated as the spread between 5-Year Treasury Constant Maturity (BC_5YEAR) and Effective Federal Funds Rate (https://fred.stlouisfed.org/series/EFFR).
Starting with the update on June 21, 2019, the Treasury bond data used in calculating interest rate spreads is obtained directly from the U.S. Treasury Department.
Suggested Citation:
Federal Reserve Bank of St. Louis, 5-Year Treasury Constant Maturity Minus Federal Funds Rate [T5YFFM], retrieved from FRED, Federal Reserve Bank of St. Louis; https://fred.stlouisfed.org/series/T5YFFM, .
Source: Organization for Economic Co-operation and Development
Release: Main Economic Indicators
Units:
Frequency:
Notes:
OECD Data Filters:
REF_AREA: USA
MEASURE: LI
UNIT_MEASURE: IX
ACTIVITY: _Z
ADJUSTMENT: NOR
TRANSFORMATION: IX
TIME_HORIZ: _Z
METHODOLOGY: H
FREQ: M
All OECD data should be cited as follows: OECD (year), (dataset name), (data source) DOI or https://data-explorer.oecd.org/. (accessed on (date)).
Suggested Citation:
Organization for Economic Co-operation and Development, Composite Leading Indicators: Composite Leading Indicator (CLI) Normalized for United States [USALOLITONOSTSAM], retrieved from FRED, Federal Reserve Bank of St. Louis; https://fred.stlouisfed.org/series/USALOLITONOSTSAM, .
Source: Board of Governors of the Federal Reserve System (US)
Release: H.4.1 Factors Affecting Reserve Balances (data not included in press release)
Units:
Frequency:
Notes:
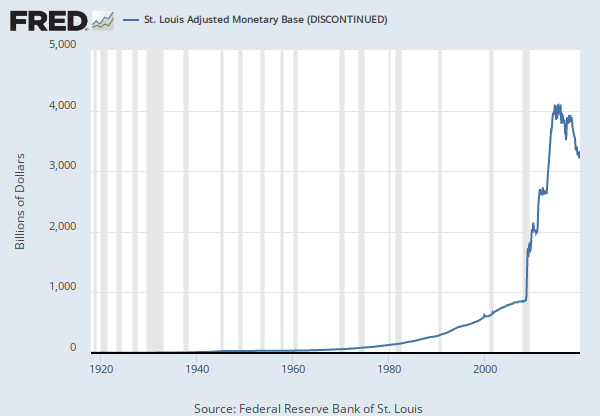
This series has been discontinued and will no longer be updated. The weekly version of this monthly series is WCURCIR.####
Suggested Citation:
Board of Governors of the Federal Reserve System (US), Currency in Circulation (DISCONTINUED) [CURRCIR], retrieved from FRED, Federal Reserve Bank of St. Louis; https://fred.stlouisfed.org/series/CURRCIR, .
Source: Federal Reserve Bank of Philadelphia
Release: State Leading Indexes
Units:
Frequency:
Notes:
The leading index for each state predicts the six-month growth rate of the state's coincident index. In addition to the coincident index, the models include other variables that lead the economy: state-level housing permits (1 to 4 units), state initial unemployment insurance claims, delivery times from the Institute for Supply Management (ISM) manufacturing survey, and the interest rate spread between the 10-year Treasury bond and the 3-month Treasury bill.
Suggested Citation:
Federal Reserve Bank of Philadelphia, Leading Index for the United States [USSLIND], retrieved from FRED, Federal Reserve Bank of St. Louis; https://fred.stlouisfed.org/series/USSLIND, .
Source: Chauvet, Marcelle
Source: Piger, Jeremy Max
Release: U.S. Recession Probabilities
Units:
Frequency:
Notes:
Smoothed recession probabilities for the United States are obtained from a dynamic-factor markov-switching model applied to four monthly coincident variables: non-farm payroll employment, the index of industrial production, real personal income excluding transfer payments, and real manufacturing and trade sales. This model was originally developed in Chauvet, M., "An Economic Characterization of Business Cycle Dynamics with Factor Structure and Regime Switching," International Economic Review, 1998, 39, 969-996.
For additional details, including an analysis of the performance of this model for dating business cycles in real time, see:
Chauvet, M. and J. Piger, "A Comparison of the Real-Time Performance of Business Cycle Dating Methods," Journal of Business and Economic Statistics, 2008, 26, 42-49.
For additional details as to why this data revises, see FAQ 3.
Suggested Citation:
Chauvet, Marcelle and Piger, Jeremy Max, Smoothed U.S. Recession Probabilities [RECPROUSM156N], retrieved from FRED, Federal Reserve Bank of St. Louis; https://fred.stlouisfed.org/series/RECPROUSM156N, .
Source: Federal Reserve Bank of San Francisco
Release: Tech Pulse
Units:
Frequency:
Notes:
The Tech Pulse release has been discontinued and will no longer update.
The Tech Pulse Index is a coincidence index of activity in the U.S. information technology sector. The index interpreted as the health of the tech sector. The indicators used to compute the index include investment in IT goods, consumption of personal computers and software, employment in the IT sector, industrial production of the technology sector, and shipments by the technology sector. For further information, please visit the Tech Pulse website at the Federal Reserve Bank of San Francisco.
Suggested Citation:
Federal Reserve Bank of San Francisco, San Francisco Tech Pulse (DISCONTINUED) [SFTPINDM114SFRBSF], retrieved from FRED, Federal Reserve Bank of St. Louis; https://fred.stlouisfed.org/series/SFTPINDM114SFRBSF, .
Source: Chicago Board Options Exchange
Release: CBOE Market Statistics
Units:
Frequency:
Notes:
VIX measures market expectation of near term volatility conveyed by stock index option prices. Copyright, 2016, Chicago Board Options Exchange, Inc. Reprinted with permission.
Suggested Citation:
Chicago Board Options Exchange, CBOE Volatility Index: VIX [VIXCLS], retrieved from FRED, Federal Reserve Bank of St. Louis; https://fred.stlouisfed.org/series/VIXCLS, .
Source: Federal Reserve Bank of St. Louis
Release: Interest Rate Spreads
Units:
Frequency:
Notes:
Starting with the update on June 21, 2019, the Treasury bond data used in calculating interest rate spreads is obtained directly from the U.S. Treasury Department.
Series is calculated as the spread between 10-Year Treasury Constant Maturity (BC_10YEAR) and 2-Year Treasury Constant Maturity (BC_2YEAR). Both underlying series are published at the U.S. Treasury Department.
Suggested Citation:
Federal Reserve Bank of St. Louis, 10-Year Treasury Constant Maturity Minus 2-Year Treasury Constant Maturity [T10Y2Y], retrieved from FRED, Federal Reserve Bank of St. Louis; https://fred.stlouisfed.org/series/T10Y2Y, .
Source: Federal Reserve Bank of St. Louis
Release: Interest Rate Spreads
Units:
Frequency:
Notes:
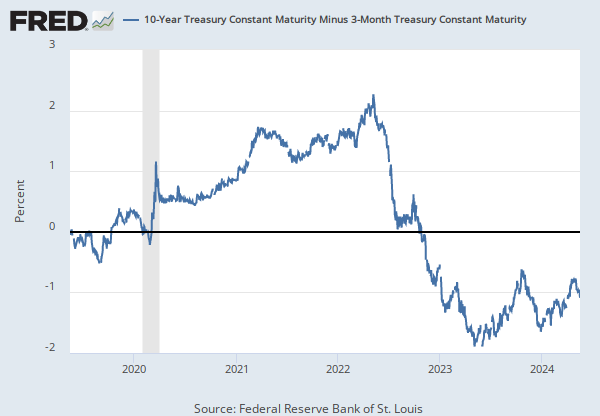
Series is calculated as the spread between 10-Year Treasury Constant Maturity (BC_10YEAR) and 3-Month Treasury Constant Maturity (BC_3MONTH).
Starting with the update on June 21, 2019, the Treasury bond data used in calculating interest rate spreads is obtained directly from the U.S. Treasury Department.
Suggested Citation:
Federal Reserve Bank of St. Louis, 10-Year Treasury Constant Maturity Minus 3-Month Treasury Constant Maturity [T10Y3M], retrieved from FRED, Federal Reserve Bank of St. Louis; https://fred.stlouisfed.org/series/T10Y3M, .
Source: Board of Governors of the Federal Reserve System (US)
Release: H.15 Selected Interest Rates
Units:
Frequency:
Notes:
Averages of daily figures.
For additional historical federal funds rate data, please see Daily Federal Funds Rate from 1928-1954.
The federal funds rate is the interest rate at which depository institutions trade federal funds (balances held at Federal Reserve Banks) with each other overnight. When a depository institution has surplus balances in its reserve account, it lends to other banks in need of larger balances. In simpler terms, a bank with excess cash, which is often referred to as liquidity, will lend to another bank that needs to quickly raise liquidity. (1) The rate that the borrowing institution pays to the lending institution is determined between the two banks; the weighted average rate for all of these types of negotiations is called the effective federal funds rate.(2) The effective federal funds rate is essentially determined by the market but is influenced by the Federal Reserve as it uses the Interest on Reserve Balances rate to steer the federal funds rate toward the target range.(2)
The Federal Open Market Committee (FOMC) meets eight times a year to determine the federal funds target range. The Fed's primary tool for influencing the federal funds rate is the interest the Fed pays on the funds that banks hold as reserve balances at their Federal Reserve Bank, which is the Interest on Reserves Balances (IORB) rate. Because banks are unlikely to lend funds in the federal funds market for less than they get paid in their reserve balance account at the Federal Reserve, the Interest on Reserve Balances (IORB) is an effective tool for guiding the federal funds rate. (3) Whether the Federal Reserve raises or lowers the target range for the federal funds rate depends on the state of the economy. If the FOMC believes the economy is growing too fast and inflation pressures are inconsistent with the dual mandate of the Federal Reserve, the Committee may temper economic activity by raising the target range for federal funds rate, and increasing the IORB rate to steer the federal funds rate into the target range. In the opposing scenario, the FOMC may spur greater economic activity by lowering the target range for federal funds rate, and decreasing the IORB rate to steer the federal funds rate into the target range. (3) Therefore, the FOMC must observe the current state of the economy to determine the best course of monetary policy that will maximize economic growth while adhering to the dual mandate set forth by Congress. In making its monetary policy decisions, the FOMC considers a wealth of economic data, such as: trends in prices and wages, employment, consumer spending and income, business investments, and foreign exchange markets.
The federal funds rate is the central interest rate in the U.S. financial market. It influences other interest rates such as the prime rate, which is the rate banks charge their customers with higher credit ratings. Additionally, the federal funds rate indirectly influences longer- term interest rates such as mortgages, loans, and savings, all of which are very important to consumer wealth and confidence.(2)
References
(1) Federal Reserve Bank of New York. "Federal funds." Fedpoints, August 2007.
(2) Monetary Policy, Board of Governors of the Federal Reserve System.
(3) The Fed Explained, Board of Governors of the Federal Reserve System
For further information, see The Fed's New Monetary Policy Tools, Page One Economics, Federal Reserve Bank of St. Louis.
For questions on the data, please contact the data source. For questions on FRED functionality, please contact us here.
Suggested Citation:
Board of Governors of the Federal Reserve System (US), Federal Funds Effective Rate [FF], retrieved from FRED, Federal Reserve Bank of St. Louis; https://fred.stlouisfed.org/series/FF, .
Source: National Bureau of Economic Research
Release: NBER Macrohistory Database
Units:
Frequency:
Notes:
Series Is Presented Here As Two Variables--(1)--Original Data, 1897-1916 (2)--Original Data, 1914-1958 20 Stocks Are Used Through September, 1928 And 30 Stocks Thereafter. A Detailed Description Of Methods Of Constucting Averages Is Given In "Basis Of Calculation Of Dow-Jones Average" Available From The Wall Street Journal. For A More Detailed Description Of The Series, See Business Cycle Indicators, Vol. Ii, Moore, NBER. This Index Is Based On Daily Closing Prices On The New York Stock Exchange. Through 1948, Averages Of Highest And Lowest Indexes For The Month Are Used. For 1949-1968, Averages Of Daily Closing Indexes Are Used. Source: Data Were Compiled By Dow Jones And Company From Quotations In The Wall Street Journal. Through June, 1952, Data Are From The Dow-Jones Averages, 13Th Edition, 1948, And Supplementary Averages (Barron'S Publishing Company). Thereafter, Through 1968, Data Are From Barron'S National Business And Financial Weekly.
This NBER data series m11009b appears on the NBER website in Chapter 11 at http://www.nber.org/databases/macrohistory/contents/chapter11.html.
NBER Indicator: m11009b
Suggested Citation:
National Bureau of Economic Research, Dow-Jones Industrial Stock Price Index for United States [M1109BUSM293NNBR], retrieved from FRED, Federal Reserve Bank of St. Louis; https://fred.stlouisfed.org/series/M1109BUSM293NNBR, .
Source: Board of Governors of the Federal Reserve System (US)
Release: H.15 Selected Interest Rates
Units:
Frequency:
Notes:
For further information regarding treasury constant maturity data, please refer to the H.15 Statistical Release notes and Treasury Yield Curve Methodology.
For questions on the data, please contact the data source. For questions on FRED functionality, please contact us here.
Suggested Citation:
Board of Governors of the Federal Reserve System (US), Market Yield on U.S. Treasury Securities at 10-Year Constant Maturity, Quoted on an Investment Basis [DGS10], retrieved from FRED, Federal Reserve Bank of St. Louis; https://fred.stlouisfed.org/series/DGS10, .
Release Tables
H.15 Selected Interest Rates
- Selected Interest Rates Instruments, Yields in percent per annum: Daily
- Selected Interest Rates Instruments, Yields in percent per annum: Weekly
H.4.1 Factors Affecting Reserve Balances
Main Economic Indicators
State Leading Indexes
Related Data and Content
Data Suggestions Based On Your Search


Content Suggestions


Other Formats
5-Year Treasury Constant Maturity Minus Federal Funds Rate
Daily, Not Seasonally AdjustedSan Francisco Tech Pulse (DISCONTINUED)
Percent Change, Monthly, Seasonally Adjusted Percent Change at Annual Rate, Monthly, Seasonally Adjusted Percent Change from Year Ago, Monthly, Seasonally Adjusted10-Year Treasury Constant Maturity Minus 2-Year Treasury Constant Maturity
Monthly, Not Seasonally Adjusted10-Year Treasury Constant Maturity Minus 3-Month Treasury Constant Maturity
Monthly, Not Seasonally AdjustedFederal Funds Effective Rate
Annual, Not Seasonally Adjusted Biweekly, Not Seasonally Adjusted Daily, Not Seasonally Adjusted Daily, Not Seasonally Adjusted Monthly, Not Seasonally AdjustedDow-Jones Industrial Stock Price Index for United States
Monthly, Not Seasonally AdjustedMarket Yield on U.S. Treasury Securities at 10-Year Constant Maturity, Quoted on an Investment Basis
Annual, Not Seasonally Adjusted Monthly, Not Seasonally Adjusted Weekly, Not Seasonally AdjustedRelated Categories
Stock Market Indexes
Financial Indicators
Money, Banking, & Finance
Factors Affecting Reserve Balances
Monetary Data
Financial Activity Measures
Interest Rate Spreads
Interest Rates
United States
Countries
International Data
Business Cycle Expansions & Contractions
Production & Business Activity
Recession Probabilities
Academic Data
Technology
Volatility Indexes
FRB Rates - discount, fed funds, primary credit
Security Markets
NBER Macrohistory Database
Treasury Constant Maturity
Releases
More
Series from Nasdaq Daily Index Data
More
Series from H.4.1 Factors Affecting Reserve Balances
More
Series from Chicago Fed National Financial Conditions Index
More
Series from Interest Rate Spreads
More
Series from Main Economic Indicators
More
Series from H.4.1 Factors Affecting Reserve Balances (data not included in press release)
More
Series from State Leading Indexes
More
Series from U.S. Recession Probabilities
More
Series from Tech Pulse
More
Series from CBOE Market Statistics
More
Series from H.15 Selected Interest Rates
More
Series from NBER Macrohistory Database
Tags
Composite
National Association of Securities Dealers Automated Quotations
Nasdaq, Inc.
Stock Market
Copyrighted: Pre-Approval Required
Daily
Indexes
Copyrighted: Citation Required
Nation
United States of America
Not Seasonally Adjusted
Coins
H.4.1 Factors Affecting Reserve Balances
Currency
Weekly
Board of Governors
Public Domain: Citation Requested
Chicago Fed National Financial Conditions Index
Chicago Fed
Adjusted
Financial
Yield Curve
Spread
Maturity
Treasury
Federal
Interest Rate
Interest
5-Year
St. Louis Fed
Rate
Monthly
Leading Indicator
Org. for Economic Co-operation and Development
Seasonally Adjusted
Discontinued
Leading Index
Philadelphia Fed
Headline Figure
Chauvet, Marcelle
Marcelle M. Chauvet and Jeremy Piger
Recession Indicators
Academic Data
San Francisco Fed
FRB San Francisco Tech Pulse
Information Technology
San Francisco
Information
Volatility Index
Chicago Board Options Exchange
Volatility
2-Year
10-Year
3-Month
H.15 Selected Interest Rates
National Bureau of Economic Research
Industry
Price Index
Price