Notes
Source: U.S. Bureau of Economic Analysis
Release: Gross Domestic Product
Units:
Frequency:
Notes:
BEA Account Code: A191RC
Suggested Citation:
U.S. Bureau of Economic Analysis, Gross Domestic Product [GDPA], retrieved from FRED, Federal Reserve Bank of St. Louis; https://fred.stlouisfed.org/series/GDPA, .
Source: U.S. Bureau of Economic Analysis
Release: Gross Domestic Product
Units:
Frequency:
Notes:
BEA Account Code: A191RC
Gross domestic product (GDP), the featured measure of U.S. output, is the market value of the goods and services produced by labor and property located in the United States.For more information, see the Guide to the National Income and Product Accounts of the United States (NIPA) and the Bureau of Economic Analysis.
Suggested Citation:
U.S. Bureau of Economic Analysis, Gross Domestic Product [GDP], retrieved from FRED, Federal Reserve Bank of St. Louis; https://fred.stlouisfed.org/series/GDP, .
Source: Federal Reserve Bank of Atlanta
Release: Sticky Price CPI
Units:
Frequency:
Notes:
The Sticky Price Consumer Price Index (CPI) is calculated from a subset of goods and services included in the CPI that change price relatively infrequently. Because these goods and services change price relatively infrequently, they are thought to incorporate expectations about future inflation to a greater degree than prices that change on a more frequent basis. One possible explanation for sticky prices could be the costs firms incur when changing price.
To obtain more information about this release see: Michael F. Bryan, and Brent H. Meyer. “Are Some Prices in the CPI More Forward Looking Than Others? We Think So.” Economic Commentary (Federal Reserve Bank of Cleveland) (May 19, 2010): 1–6. https://doi.org/10.26509/frbc-ec-201002.
Suggested Citation:
Federal Reserve Bank of Atlanta, Sticky Price Consumer Price Index less Food and Energy [CORESTICKM159SFRBATL], retrieved from FRED, Federal Reserve Bank of St. Louis; https://fred.stlouisfed.org/series/CORESTICKM159SFRBATL, .
Source: U.S. Bureau of Labor Statistics
Release: Consumer Price Index
Units:
Frequency:
Notes:
The "Consumer Price Index for All Urban Consumers: All Items Less Food & Energy" is an aggregate of prices paid by urban consumers for a typical basket of goods, excluding food and energy. This measurement, known as "Core CPI," is widely used by economists because food and energy have very volatile prices. The Bureau of Labor Statistics defines and measures the official CPI, and more information can be found in the FAQ or in this article.
Suggested Citation:
U.S. Bureau of Labor Statistics, Consumer Price Index for All Urban Consumers: All Items Less Food and Energy in U.S. City Average [CPILFESL], retrieved from FRED, Federal Reserve Bank of St. Louis; https://fred.stlouisfed.org/series/CPILFESL, .
Source: U.S. Bureau of Labor Statistics
Release: Employment Situation
Units:
Frequency:
Notes:
The unemployment rate represents the number of unemployed as a percentage of the labor force. Labor force data are restricted to people 16 years of age and older, who currently reside in 1 of the 50 states or the District of Columbia, who do not reside in institutions (e.g., penal and mental facilities, homes for the aged), and who are not on active duty in the Armed Forces.
This rate is also defined as the U-3 measure of labor underutilization.
The series comes from the 'Current Population Survey (Household Survey)'
The source code is: LNS14000000
Suggested Citation:
U.S. Bureau of Labor Statistics, Unemployment Rate [UNRATE], retrieved from FRED, Federal Reserve Bank of St. Louis; https://fred.stlouisfed.org/series/UNRATE, .
Source: U.S. Bureau of Labor Statistics
Release: Employment Situation
Units:
Frequency:
Notes:
The series comes from the 'Current Population Survey (Household Survey)'
The source code is: LNS13000000
The Unemployment Level is the aggregate measure of people currently unemployed in the US. Someone in the labor force is defined as unemployed if they were not employed during the survey reference week, were available for work, and made at least one active effort to find a job during the 4-week survey period.
The Unemployment Level is collected in the CPS and published by the BLS. It is provided on a monthly basis, so this data is used in part by macroeconomists as an initial economic indicator of current trends. The Unemployment Level helps government agencies, financial markets, and researchers gauge the overall health of the economy.
Note that individuals that are not employed but not actively looking for a job are not counted as unemployed. For instance, declines in the Unemployment Level may either reflect movements of unemployed individuals into the labor force because they found a job, or movements of unemployed individuals out of the labor force because they stopped looking to find a job.
For more information, see:
U.S. Bureau of Labor Statistics, CES Overview
U.S. Bureau of Labor Statistics, BLS Handbook of Methods: Chapter 2. Employment, Hours, and Earnings from the Establishment Survey
Suggested Citation:
U.S. Bureau of Labor Statistics, Unemployment Level [UNEMPLOY], retrieved from FRED, Federal Reserve Bank of St. Louis; https://fred.stlouisfed.org/series/UNEMPLOY, .
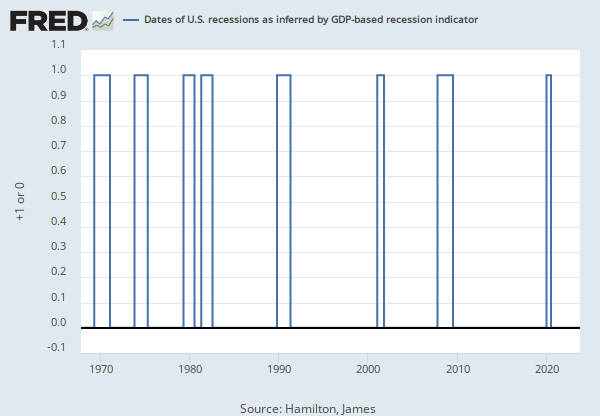
Source: Chauvet, Marcelle
Source: Piger, Jeremy Max
Release: U.S. Recession Probabilities
Units:
Frequency:
Notes:
Smoothed recession probabilities for the United States are obtained from a dynamic-factor markov-switching model applied to four monthly coincident variables: non-farm payroll employment, the index of industrial production, real personal income excluding transfer payments, and real manufacturing and trade sales. This model was originally developed in Chauvet, M., "An Economic Characterization of Business Cycle Dynamics with Factor Structure and Regime Switching," International Economic Review, 1998, 39, 969-996.
For additional details, including an analysis of the performance of this model for dating business cycles in real time, see:
Chauvet, M. and J. Piger, "A Comparison of the Real-Time Performance of Business Cycle Dating Methods," Journal of Business and Economic Statistics, 2008, 26, 42-49.
For additional details as to why this data revises, see FAQ 3.
Suggested Citation:
Chauvet, Marcelle and Piger, Jeremy Max, Smoothed U.S. Recession Probabilities [RECPROUSM156N], retrieved from FRED, Federal Reserve Bank of St. Louis; https://fred.stlouisfed.org/series/RECPROUSM156N, .
Release Tables
Consumer Price Index
Employment Situation
Employment Situation
- Monthly, Seasonally Adjusted (population data is not adjusted for seasonal variation; not seasonally adjusted version used)
- Table A-10. Selected unemployment indicators, Seasonally adjusted: Monthly, Numbers of unemployed workers
- Table A-10. Selected unemployment indicators, Seasonally adjusted: Monthly, Unemployment Rates
- Table A-15. Alternative measures of labor underutilization: Monthly, Seasonally Adjusted
Gross Domestic Product
- Table 1.1.5. Gross Domestic Product: Annual
- Table 1.1.5. Gross Domestic Product: Quarterly
- Table 1.2.5. Gross Domestic Product by Major Type of Product: Annual
- Table 1.2.5. Gross Domestic Product by Major Type of Product: Quarterly
- Table 1.3.5. Gross Value Added by Sector: Annual
- Table 1.3.5. Gross Value Added by Sector: Quarterly
- Table 1.4.5. Relation of Gross Domestic Product, Gross Domestic Purchases, and Final Sales to Domestic Purchasers: Annual
- Table 1.4.5. Relation of Gross Domestic Product, Gross Domestic Purchases, and Final Sales to Domestic Purchasers: Quarterly
- Table 1.5.5. Gross Domestic Product, Expanded Detail: Annual
- Table 1.5.5. Gross Domestic Product, Expanded Detail: Quarterly
- Table 1.7.5. Relation of Gross Domestic Product, Gross National Product, Net National Product, National Income, and Personal Income: Annual
- Table 1.7.5. Relation of Gross Domestic Product, Gross National Product, Net National Product, National Income, and Personal Income: Quarterly
- Table 1.17.5. Gross Domestic Product, Gross Domestic Income, and Other Major NIPA Aggregates: Annual
- Table 1.17.5. Gross Domestic Product, Gross Domestic Income, and Other Major NIPA Aggregates: Quarterly
Related Data and Content
Data Suggestions Based On Your Search


Content Suggestions


Other Formats
Gross Domestic Product
Annual, Not Seasonally Adjusted Annual, Not Seasonally Adjusted Index 2017=100, Quarterly, Not Seasonally Adjusted Millions of Dollars, Quarterly, Not Seasonally Adjusted Percent Change from Preceding Period, Annual, Not Seasonally Adjusted Percent Change from Preceding Period, Quarterly, Seasonally Adjusted Annual RateSticky Price Consumer Price Index less Food and Energy
3-Month Annualized Percent Change, Monthly, Seasonally Adjusted Percent Change, Monthly, Seasonally Adjusted Percent Change at Annual Rate, Monthly, Seasonally AdjustedConsumer Price Index for All Urban Consumers: All Items Less Food and Energy in U.S. City Average
Monthly, Not Seasonally Adjusted Semiannual, Not Seasonally AdjustedUnemployment Rate
Monthly, Not Seasonally AdjustedUnemployment Level
Monthly, Not Seasonally AdjustedRelated Categories
GDP/GNP
National Income & Product Accounts
National Accounts
Special Indexes
Consumer Price Indexes (CPI and PCE)
Prices
Unemployment Rate
Current Population Survey (Household Survey)
Population, Employment, & Labor Markets
Unemployment Level
Recession Probabilities
Academic Data
Releases
More
Series from Gross Domestic Product
More
Series from Sticky Price CPI
More
Series from Consumer Price Index
More
Series from Employment Situation
More
Series from U.S. Recession Probabilities
Tags
National Income and Product Accounts
Bureau of Economic Analysis
Gross Domestic Product
Annual
Nation
Public Domain: Citation Requested
United States of America
Not Seasonally Adjusted
Quarterly
Seasonally Adjusted
Sticky
Atlanta Fed
Core Inflation
Consumer Price Index
Inflation
Price Index
Rate
Indexes
Price
Copyrighted: Citation Required
Monthly
Headline Figure
All Items
Urban
Consumer
Bureau of Labor Statistics
Labor Underutilization
Civilian
16 Years +
Labor
Current Population Survey (Household Survey)
Unemployment
Chauvet, Marcelle
Marcelle M. Chauvet and Jeremy Piger
Recession Indicators
Academic Data