Notes
Source: Board of Governors of the Federal Reserve System (US)
Release: H.8 Assets and Liabilities of Commercial Banks in the United States
Units:
Frequency:
Notes:
For questions on the data, please contact the data source. For questions on FRED functionality, please contact us here.
Suggested Citation:
Board of Governors of the Federal Reserve System (US), Cash Assets, All Commercial Banks [CASACBW027SBOG], retrieved from FRED, Federal Reserve Bank of St. Louis; https://fred.stlouisfed.org/series/CASACBW027SBOG, .
Source: Board of Governors of the Federal Reserve System (US)
Release: H.4.1 Factors Affecting Reserve Balances
Units:
Frequency:
Notes:
For questions on the data, please contact the data source. For questions on FRED functionality, please contact us here.
Suggested Citation:
Board of Governors of the Federal Reserve System (US), Assets: Central Bank Liquidity Swaps: Central Bank Liquidity Swaps: Wednesday Level [SWPT], retrieved from FRED, Federal Reserve Bank of St. Louis; https://fred.stlouisfed.org/series/SWPT, .
Source: U.S. Federal Open Market Committee
Source: Federal Reserve Bank of St. Louis
Release: Summary of Economic Projections
Units:
Frequency:
Notes:
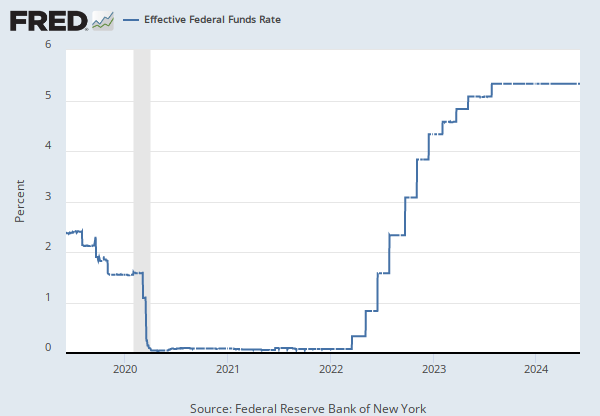
The projections for the federal funds rate are the value of the midpoint of the projected appropriate target range for the federal funds rate or the projected appropriate target level for the federal funds rate at the end of the specified calendar year or over the longer run. Each participant's projections are based on his or her assessment of appropriate monetary policy. The range for each variable in a given year includes all participants' projections, from lowest to highest, for that variable in the given year. This series represents the median value of the range forecast established by the Federal Open Market Committee. For each period, the median is the middle projection when the projections are arranged from lowest to highest. When the number of projections is even, the median is the average of the two middle projections.
Digitized originals of this release can be found at https://fraser.stlouisfed.org/publication/?pid=677.
Suggested Citation:
U.S. Federal Open Market Committee and Federal Reserve Bank of St. Louis, FOMC Summary of Economic Projections for the Fed Funds Rate, Median [FEDTARMD], retrieved from FRED, Federal Reserve Bank of St. Louis; https://fred.stlouisfed.org/series/FEDTARMD, .
Source: Nasdaq, Inc.
Release: Nasdaq Daily Index Data
Units:
Frequency:
Notes:
The observations for the NASDAQ Composite Index represent the daily index value at market close. The market typically closes at 4 PM ET, except for holidays when it sometimes closes early.
The NASDAQ Composite Index is a market capitalization weighted index with more than 3000 common equities listed on the NASDAQ Stock Market. The types of securities in the index include American depositary receipts (ADRs), common stocks, real estate investment trusts (REITs), and tracking stocks. The index includes all NASDAQ listed stocks that are not derivatives, preferred shares, funds, exchange-traded funds (ETFs) or debentures.
Copyright © 2016, NASDAQ OMX Group, Inc.
Suggested Citation:
Nasdaq, Inc., NASDAQ Composite [NASDAQCOM], retrieved from FRED, Federal Reserve Bank of St. Louis; https://fred.stlouisfed.org/series/NASDAQCOM, .
Source: S&P Dow Jones Indices LLC
Release: Standard & Poors
Units:
Frequency:
Notes:
The observations for the S&P 500 represent the daily index value at market close. The market typically closes at 4 PM ET, except for holidays when it sometimes closes early.
The Federal Reserve Bank of St. Louis and S&P Dow Jones Indices LLC have reached a new agreement on the use of Standard & Poors and Dow Jones Averages series in FRED. FRED and its associated services will include 10 years of daily history for Standard & Poors and Dow Jones Averages series.
The S&P 500 is regarded as a gauge of the large cap U.S. equities market. The index includes 500 leading companies in leading industries of the U.S. economy, which are publicly held on either the NYSE or NASDAQ, and covers 75% of U.S. equities. Since this is a price index and not a total return index, the S&P 500 index here does not contain dividends.
Copyright © 2016, S&P Dow Jones Indices LLC. All rights reserved. Reproduction of S&P 500 in any form is prohibited except with the prior written permission of S&P Dow Jones Indices LLC ("S&P"). S&P does not guarantee the accuracy, adequacy, completeness or availability of any information and is not responsible for any errors or omissions, regardless of the cause or for the results obtained from the use of such information. S&P DISCLAIMS ANY AND ALL EXPRESS OR IMPLIED WARRANTIES, INCLUDING, BUT NOT LIMITED TO, ANY WARRANTIES OF MERCHANTABILITY OR FITNESS FOR A PARTICULAR PURPOSE OR USE. In no event shall S&P be liable for any direct, indirect, special or consequential damages, costs, expenses, legal fees, or losses (including lost income or lost profit and opportunity costs) in connection with subscriber's or others' use of S&P 500.
Permission to reproduce S&P 500 can be requested from index_services@spdji.com. More contact details are available here, including phone numbers for all regional offices.
Suggested Citation:
S&P Dow Jones Indices LLC, S&P 500 [SP500], retrieved from FRED, Federal Reserve Bank of St. Louis; https://fred.stlouisfed.org/series/SP500, .
Source: Federal Reserve Bank of St. Louis
Release: Interest Rate Spreads
Units:
Frequency:
Notes:
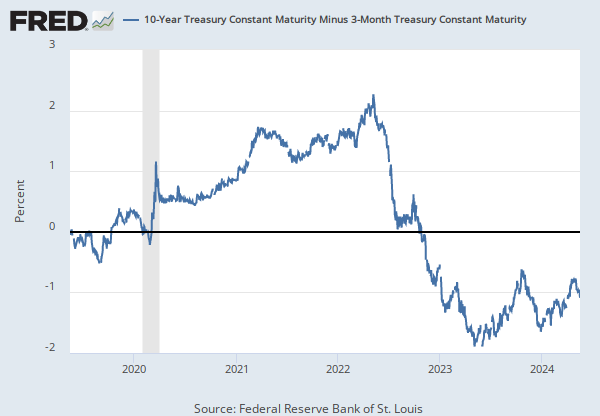
Series is calculated as the spread between 10-Year Treasury Constant Maturity (BC_10YEAR) and 3-Month Treasury Constant Maturity (BC_3MONTH).
Starting with the update on June 21, 2019, the Treasury bond data used in calculating interest rate spreads is obtained directly from the U.S. Treasury Department.
Suggested Citation:
Federal Reserve Bank of St. Louis, 10-Year Treasury Constant Maturity Minus 3-Month Treasury Constant Maturity [T10Y3M], retrieved from FRED, Federal Reserve Bank of St. Louis; https://fred.stlouisfed.org/series/T10Y3M, .
Source: Board of Governors of the Federal Reserve System (US)
Release: H.15 Selected Interest Rates
Units:
Frequency:
Notes:
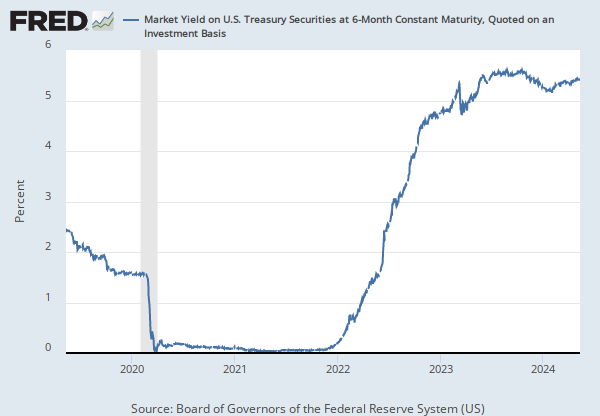
For further information regarding treasury constant maturity data, please refer to the H.15 Statistical Release notes and Treasury Yield Curve Methodology.
For questions on the data, please contact the data source. For questions on FRED functionality, please contact us here.
Suggested Citation:
Board of Governors of the Federal Reserve System (US), Market Yield on U.S. Treasury Securities at 10-Year Constant Maturity, Quoted on an Investment Basis [DGS10], retrieved from FRED, Federal Reserve Bank of St. Louis; https://fred.stlouisfed.org/series/DGS10, .
Source: Federal Reserve Bank of St. Louis
Release: Interest Rate Spreads
Units:
Frequency:
Notes:
The breakeven inflation rate represents a measure of expected inflation derived from 10-Year Treasury Constant Maturity Securities (DGS10) and 10-Year Treasury Inflation-Indexed Constant Maturity Securities (DFII10). The latest value implies what market participants expect inflation to be in the next 10 years, on average.
Starting with the update on June 21, 2019, the Treasury bond data used in calculating interest rate spreads is obtained directly from the U.S. Treasury Department.
Suggested Citation:
Federal Reserve Bank of St. Louis, 10-Year Breakeven Inflation Rate [T10YIE], retrieved from FRED, Federal Reserve Bank of St. Louis; https://fred.stlouisfed.org/series/T10YIE, .
Source: Board of Governors of the Federal Reserve System (US)
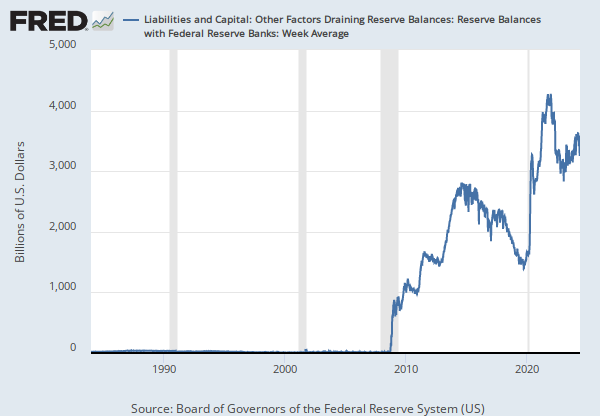
Release: H.4.1 Factors Affecting Reserve Balances
Units:
Frequency:
Notes:
For questions on the data, please contact the data source. For questions on FRED functionality, please contact us here.
Suggested Citation:
Board of Governors of the Federal Reserve System (US), Liabilities and Capital: Other Factors Draining Reserve Balances: Currency in Circulation: Week Average [WCURCIR], retrieved from FRED, Federal Reserve Bank of St. Louis; https://fred.stlouisfed.org/series/WCURCIR, .
Source: U.S. Energy Information Administration
Release: Spot Prices
Units:
Frequency:
Notes:
Definitions, Sources and Explanatory Notes
Suggested Citation:
U.S. Energy Information Administration, Crude Oil Prices: West Texas Intermediate (WTI) - Cushing, Oklahoma [DCOILWTICO], retrieved from FRED, Federal Reserve Bank of St. Louis; https://fred.stlouisfed.org/series/DCOILWTICO, .
Source: Board of Governors of the Federal Reserve System (US)
Release: H.4.1 Factors Affecting Reserve Balances
Units:
Frequency:
Notes:
For questions on the data, please contact the data source. For questions on FRED functionality, please contact us here.
Suggested Citation:
Board of Governors of the Federal Reserve System (US), Assets: Liquidity and Credit Facilities: Loans: Primary Credit: Wednesday Level [WLCFLPCL], retrieved from FRED, Federal Reserve Bank of St. Louis; https://fred.stlouisfed.org/series/WLCFLPCL, .
Source: Federal Reserve Bank of St. Louis
Release: Recession Indicators Series
Units:
Frequency:
Notes:
This time series is an interpretation of Organisation of Economic Development (OECD) Composite Leading Indicators: Reference Turning Points and Component Series data, which can be found at http://www.oecd.org/std/leading-indicators/oecdcompositeleadingindicatorsreferenceturningpointsandcomponentseries.htm. The OECD identifies months of turning points without designating a date within the month that turning points occurred. The dummy variable adopts an arbitrary convention that the turning point occurred at a specific date within the month. The arbitrary convention does not reflect any judgment on this issue by the OECD. Our time series is composed of dummy variables that represent periods of expansion and recession. A value of 1 is a recessionary period, while a value of 0 is an expansionary period. For this time series, the recession begins on the 15th day of the month of the peak and ends on the 15th day of the month of the trough. This time series is a disaggregation of the monthly series. For more options on recession shading, see the note and links below.
The recession shading data that we provide initially comes from the source as a list of dates that are either an economic peak or trough. We interpret dates into recession shading data using one of three arbitrary methods. All of our recession shading data is available using all three interpretations. The period between a peak and trough is always shaded as a recession. The peak and trough are collectively extrema. Depending on the application, the extrema, both individually and collectively, may be included in the recession period in whole or in part. In situations where a portion of a period is included in the recession, the whole period is deemed to be included in the recession period.
The first interpretation, known as the midpoint method, is to show a recession from the midpoint of the peak through the midpoint of the trough for monthly and quarterly data. For daily data, the recession begins on the 15th of the month of the peak and ends on the 15th of the month of the trough. Daily data is a disaggregation of monthly data. For monthly and quarterly data, the entire peak and trough periods are included in the recession shading. This method shows the maximum number of periods as a recession for monthly and quarterly data. The Federal Reserve Bank of St. Louis uses this method in its own publications. The midpoint method is used for this series.
The second interpretation, known as the trough method, is to show a recession from the period following the peak through the trough (i.e. the peak is not included in the recession shading, but the trough is). For daily data, the recession begins on the first day of the first month following the peak and ends on the last day of the month of the trough. Daily data is a disaggregation of monthly data. The trough method is used when displaying data on FRED graphs. A version of this time series represented using the trough method can be found at:
https://fred.stlouisfed.org/series/USARECD
The third interpretation, known as the peak method, is to show a recession from the period of the peak to the trough (i.e. the peak is included in the recession shading, but the trough is not). For daily data, the recession begins on the first day of the month of the peak and ends on the last day of the month preceding the trough. Daily data is a disaggregation of monthly data. A version of this time series represented using the peak method can be found at:
https://fred.stlouisfed.org/series/USARECDP
The OECD CLI system is based on the "growth cycle" approach, where business cycles and turning points are measured and identified in the deviation-from-trend series. The main reference series used in the OECD CLI system for the majority of countries is industrial production (IIP) covering all industry sectors excluding construction. This series is used because of its cyclical sensitivity and monthly availability, while the broad based Gross Domestic Product (GDP) is used to supplement the IIP series for identification of the final reference turning points in the growth cycle.
Zones aggregates of the CLIs and the reference series are calculated as weighted averages of the corresponding zone member series (i.e. CLIs and IIPs).
Up to December 2008 the turning points chronologies shown for regional/zone area aggregates or individual countries are determined by the rules established by the National Bureau of Economic Research (NBER) in the United States, which have been formalized and incorporated in a computer routine (Bry and Boschan) and included in the Phase-Average Trend (PAT) de-trending procedure. Starting from December 2008 the turning point detection algorithm is decoupled from the de-trending procedure, and is a simplified version of the original Bry and Boschan routine. (The routine parses local minima and maxima in the cycle series and applies censor rules to guarantee alternating peaks and troughs, as well as phase and cycle length constraints.)
The components of the CLI are time series which exhibit leading relationship with the reference series (IIP) at turning points. Country CLIs are compiled by combining de-trended smoothed and normalized components. The component series for each country are selected based on various criteria such as economic significance; cyclical behavior; data quality; timeliness and availability.
OECD data should be cited as follows: OECD Composite Leading Indicators, "Composite Leading Indicators: Reference Turning Points and Component Series", http://www.oecd.org/std/leading-indicators/oecdcompositeleadingindicatorsreferenceturningpointsandcomponentseries.htm (Accessed on date)
Suggested Citation:
Federal Reserve Bank of St. Louis, OECD based Recession Indicators for the United States from the Peak through the Trough (DISCONTINUED) [USARECDM], retrieved from FRED, Federal Reserve Bank of St. Louis; https://fred.stlouisfed.org/series/USARECDM, .
Source: Federal Reserve Bank of St. Louis
Release: Interest Rate Spreads
Units:
Frequency:
Notes:
Starting with the update on June 21, 2019, the Treasury bond data used in calculating interest rate spreads is obtained directly from the U.S. Treasury Department.
Series is calculated as the spread between 10-Year Treasury Constant Maturity (BC_10YEAR) and 2-Year Treasury Constant Maturity (BC_2YEAR). Both underlying series are published at the U.S. Treasury Department.
Suggested Citation:
Federal Reserve Bank of St. Louis, 10-Year Treasury Constant Maturity Minus 2-Year Treasury Constant Maturity [T10Y2Y], retrieved from FRED, Federal Reserve Bank of St. Louis; https://fred.stlouisfed.org/series/T10Y2Y, .
Source: Federal Reserve Bank of New York
Release: Temporary Open Market Operations
Units:
Frequency:
Notes:
This series is constructed as the aggregated daily amount value of the RRP transactions reported by the New York Fed as part of the Temporary Open Market Operations.
Temporary open market operations involve short-term repurchase and reverse repurchase agreements that are designed to temporarily add or drain reserves available to the banking system and influence day-to-day trading in the federal funds market.
A reverse repurchase agreement (known as reverse repo or RRP) is a transaction in which the New York Fed under the authorization and direction of the Federal Open Market Committee sells a security to an eligible counterparty with an agreement to repurchase that same security at a specified price at a specific time in the future. For these transactions, eligible securities are U.S. Treasury instruments, federal agency debt and the mortgage-backed securities issued or fully guaranteed by federal agencies.
For more information, see https://www.newyorkfed.org/markets/rrp_faq.html
Suggested Citation:
Federal Reserve Bank of New York, Overnight Reverse Repurchase Agreements: Treasury Securities Sold by the Federal Reserve in the Temporary Open Market Operations [RRPONTSYD], retrieved from FRED, Federal Reserve Bank of St. Louis; https://fred.stlouisfed.org/series/RRPONTSYD, .
Source: Board of Governors of the Federal Reserve System (US)
Release: H.15 Selected Interest Rates
Units:
Frequency:
Notes:
For further information regarding treasury constant maturity data, please refer to the H.15 Statistical Release notes and the Treasury Yield Curve Methodology.
For questions on the data, please contact the data source. For questions on FRED functionality, please contact us here.
Suggested Citation:
Board of Governors of the Federal Reserve System (US), Market Yield on U.S. Treasury Securities at 2-Year Constant Maturity, Quoted on an Investment Basis [DGS2], retrieved from FRED, Federal Reserve Bank of St. Louis; https://fred.stlouisfed.org/series/DGS2, .
Source: National Association of Realtors
Release: Existing Home Sales
Units:
Frequency:
Notes:
The National Association of Realtors monthly housing indicators are based on a representative sample of local boards and multiple listing services. Sales volume, inventory, and price levels for existing homes are measured for the US in aggregate and by census region. Existing homes, unlike new homes, are homes that are owned and occupied before coming onto the market.
Inventory indicates the number of properties marked as "active" on the market or those pending sales. When a seller lists a property, it becomes counted as inventory.
For more information, see Methodology: Existing-Home Sales.
Copyright, 2016, National Association of Realtors. Reprinted with permission.
Suggested Citation:
National Association of Realtors, Existing Home Sales: Housing Inventory [HOSINVUSM495N], retrieved from FRED, Federal Reserve Bank of St. Louis; https://fred.stlouisfed.org/series/HOSINVUSM495N, .
Source: U.S. Census Bureau
Source: U.S. Department of Housing and Urban Development
Release: New Residential Sales
Units:
Frequency:
Suggested Citation:
U.S. Census Bureau and U.S. Department of Housing and Urban Development, New One Family Homes for Sale in the United States [HNFSEPUSSA], retrieved from FRED, Federal Reserve Bank of St. Louis; https://fred.stlouisfed.org/series/HNFSEPUSSA, .
Source: U.S. Census Bureau
Source: U.S. Department of Housing and Urban Development
Release: New Residential Sales
Units:
Frequency:
Suggested Citation:
U.S. Census Bureau and U.S. Department of Housing and Urban Development, New One Family Houses Sold: United States [HSN1F], retrieved from FRED, Federal Reserve Bank of St. Louis; https://fred.stlouisfed.org/series/HSN1F, .
Source: U.S. Census Bureau
Source: U.S. Department of Housing and Urban Development
Release: New Residential Construction
Units:
Frequency:
Notes:
Starting with the 2005-02-16 release, the series reflects an increase in the universe of permit-issuing places from 19,000 to 20,000 places.
Suggested Citation:
U.S. Census Bureau and U.S. Department of Housing and Urban Development, New Privately-Owned Housing Units Authorized in Permit-Issuing Places: Total Units [PERMIT], retrieved from FRED, Federal Reserve Bank of St. Louis; https://fred.stlouisfed.org/series/PERMIT, .
Source: Federal Reserve Bank of Chicago
Release: Chicago Fed National Financial Conditions Index
Units:
Frequency:
Notes:
The Chicago Fed’s National Financial Conditions Index (NFCI) provides a comprehensive weekly update on U.S. financial conditions in money markets, debt and equity markets and the traditional and “shadow” banking systems. Positive values of the NFCI indicate financial conditions that are tighter than average, while negative values indicate financial conditions that are looser than average.
The adjusted NFCI (ANFCI). This index isolates a component of financial conditions uncorrelated with economic conditions to provide an update on how financial conditions compare with current economic conditions.
For further information, please visit the Federal Reserve Bank of Chicago's web site: http://www.chicagofed.org/webpages/publications/nfci/index.cfm
Suggested Citation:
Federal Reserve Bank of Chicago, Chicago Fed Adjusted National Financial Conditions Index [ANFCI], retrieved from FRED, Federal Reserve Bank of St. Louis; https://fred.stlouisfed.org/series/ANFCI, .
Source: Board of Governors of the Federal Reserve System (US)
Units:
Frequency:
Notes:
Kim and Wright (2005) produced this data by fitting a simple three-factor arbitrage-free term structure model to U.S. Treasury yields since 1990, in order to evaluate the behavior of long-term yields, distant-horizon forward rates, and term premiums. For the full paper, please go to http://www.federalreserve.gov/pubs/feds/2005/200533/200533abs.html
Suggested Citation:
Board of Governors of the Federal Reserve System (US), Fitted Yield on a 2 Year Zero Coupon Bond [THREEFY2], retrieved from FRED, Federal Reserve Bank of St. Louis; https://fred.stlouisfed.org/series/THREEFY2, .
Source: American Financial Exchange
Release: Historical Overnight AMERIBOR Unsecured Interest Rate
Units:
Frequency:
Notes:
AMERIBOR® (American Interbank Offered Rate) is a benchmark interest rate based on overnight unsecured loans transacted on the American Financial Exchange (AFX). AMERIBOR® is calculated as the transaction volume weighted average interest rate of the daily transactions in the AMERIBOR® overnight unsecured loan market on the AFX. The arbitrage free AMERIBOR® Term Structure of Interest Rates is derived from the Overnight Unsecured AMERIBOR® Interest Rate (AMERIBOR) and the implied AMERIBOR® forward rates from the AMERIBOR® futures prices. More details about AMERIBOR® methodology can be found on the source's website, under the Resources section.
AMERIBOR® is a registered trademark of the American Financial Exchange (AFX). © Copyright, American Financial Exchange (AFX). All Rights Reserved.
Suggested Citation:
American Financial Exchange, 2-Year AMERIBOR Term Structure of Interest Rates (DISCONTINUED) [AMBOR2Y], retrieved from FRED, Federal Reserve Bank of St. Louis; https://fred.stlouisfed.org/series/AMBOR2Y, .
Source: American Financial Exchange
Release: Historical Overnight AMERIBOR Unsecured Interest Rate
Units:
Frequency:
Notes:
Data prior to June 17, 2019 is only available from Monday to Friday (excluding trading holidays).
AMERIBOR® (American Interbank Offered Rate) is a benchmark interest rate based on overnight unsecured loans transacted on the American Financial Exchange (AFX). AMERIBOR® is calculated as the transaction volume weighted average interest rate of the daily transactions in the AMERIBOR® overnight unsecured loan market on the AFX. More details about AMERIBOR® methodology can be found on the source's website, under the Resources section.
AMERIBOR® is a registered trademark of the American Financial Exchange (AFX). © Copyright, American Financial Exchange (AFX). All Rights Reserved.
Suggested Citation:
American Financial Exchange, Overnight Unsecured AMERIBOR Benchmark Interest Rate [AMERIBOR], retrieved from FRED, Federal Reserve Bank of St. Louis; https://fred.stlouisfed.org/series/AMERIBOR, .
Source: American Financial Exchange
Release: Historical Overnight AMERIBOR Unsecured Interest Rate
Units:
Frequency:
Notes:
AMERIBOR® (American Interbank Offered Rate) is a benchmark interest rate based on overnight unsecured loans transacted on the American Financial Exchange (AFX). AMERIBOR® is calculated as the transaction volume weighted average interest rate of the daily transactions in the AMERIBOR® overnight unsecured loan market on the AFX. The arbitrage free AMERIBOR® Term Structure of Interest Rates is derived from the Overnight Unsecured AMERIBOR® Interest Rate (AMERIBOR) and the implied AMERIBOR® forward rates from the AMERIBOR® futures prices. More details about AMERIBOR® methodology can be found on the source's website, under the Resources section.
AMERIBOR® is a registered trademark of the American Financial Exchange (AFX). © Copyright, American Financial Exchange (AFX). All Rights Reserved.
Suggested Citation:
American Financial Exchange, 3-Month AMERIBOR Term Structure of Interest Rates (DISCONTINUED) [AMBOR3M], retrieved from FRED, Federal Reserve Bank of St. Louis; https://fred.stlouisfed.org/series/AMBOR3M, .
Source: Board of Governors of the Federal Reserve System (US)
Release: H.15 Selected Interest Rates
Units:
Frequency:
Notes:
For further information regarding treasury constant maturity data, please refer to the H.15 Statistical Release notes and the Treasury Yield Curve Methodology.
For questions on the data, please contact the data source. For questions on FRED functionality, please contact us here.
Suggested Citation:
Board of Governors of the Federal Reserve System (US), Market Yield on U.S. Treasury Securities at 3-Month Constant Maturity, Quoted on an Investment Basis [DGS3MO], retrieved from FRED, Federal Reserve Bank of St. Louis; https://fred.stlouisfed.org/series/DGS3MO, .
Release Tables
An Arbitrage-Free Three-Factor Term Structure Model and the Recent Behavior of Long-Term Yields and Distant-Horizon Forward Rates
Existing Home Sales
H.15 Selected Interest Rates
H.4.1 Factors Affecting Reserve Balances
- Table 1. Factors Affecting Reserve Balances of Depository Institutions: Wednesday Level
- Table 1. Factors Affecting Reserve Balances of Depository Institutions: Week Average
- Table 2. Maturity Distribution of Securities, Loans, and Selected Other Assets and Liabilities
- Table 5. Consolidated Statement of Condition of All Federal Reserve Banks
- Table 6. Statement of Condition of Each Federal Reserve Bank
H.8 Assets and Liabilities of Commercial Banks in the United States
Historical Overnight AMERIBOR Unsecured Interest Rate
New Residential Construction
New Residential Sales
Summary of Economic Projections
Temporary Open Market Operations
Related Data and Content
Data Suggestions Based On Your Search


Content Suggestions


Other Formats
Cash Assets, All Commercial Banks
Monthly, Not Seasonally Adjusted Monthly, Seasonally Adjusted Weekly, Not Seasonally Adjusted Percent Change at Annual Rate, Annual, Seasonally Adjusted Percent Change at Annual Rate, Monthly, Seasonally Adjusted Percent Change at Annual Rate, Quarterly, Seasonally Adjusted10-Year Treasury Constant Maturity Minus 3-Month Treasury Constant Maturity
Monthly, Not Seasonally AdjustedMarket Yield on U.S. Treasury Securities at 10-Year Constant Maturity, Quoted on an Investment Basis
Annual, Not Seasonally Adjusted Monthly, Not Seasonally Adjusted Weekly, Not Seasonally Adjusted10-Year Breakeven Inflation Rate
Monthly, Not Seasonally AdjustedCrude Oil Prices: West Texas Intermediate (WTI) - Cushing, Oklahoma
Annual, Not Seasonally Adjusted Monthly, Not Seasonally Adjusted Weekly, Not Seasonally AdjustedOECD based Recession Indicators for the United States from the Peak through the Trough (DISCONTINUED)
Monthly, Not Seasonally Adjusted10-Year Treasury Constant Maturity Minus 2-Year Treasury Constant Maturity
Monthly, Not Seasonally AdjustedMarket Yield on U.S. Treasury Securities at 2-Year Constant Maturity, Quoted on an Investment Basis
Annual, Not Seasonally Adjusted Monthly, Not Seasonally Adjusted Weekly, Not Seasonally AdjustedNew One Family Houses Sold: United States
Thousands of Units, Annual, Not Seasonally Adjusted Thousands of Units, Monthly, Not Seasonally AdjustedNew Privately-Owned Housing Units Authorized in Permit-Issuing Places: Total Units
Monthly, Not Seasonally AdjustedMarket Yield on U.S. Treasury Securities at 3-Month Constant Maturity, Quoted on an Investment Basis
Annual, Not Seasonally Adjusted Monthly, Not Seasonally Adjusted Weekly, Not Seasonally AdjustedRelated Categories
All Commercial Banks
Commercial Banking
Banking
Money, Banking, & Finance
Securities, Loans, & Other Assets & Liabilities Held by Fed
Monetary Data
FRB Rates - discount, fed funds, primary credit
Interest Rates
Stock Market Indexes
Financial Indicators
Interest Rate Spreads
Treasury Constant Maturity
Factors Affecting Reserve Balances
Commodities
Prices
United States
Countries
International Data
Business Cycle Expansions & Contractions
Production & Business Activity
Housing
New Residential Sales
Housing Units Authorized by Building Permits
Financial Activity Measures
Data on the nominal term structure model from Kim and Wright
Academic Data
AMERIBOR Benchmark Rates
Releases
More
Series from H.8 Assets and Liabilities of Commercial Banks in the United States
More
Series from H.4.1 Factors Affecting Reserve Balances
More
Series from Summary of Economic Projections
More
Series from Nasdaq Daily Index Data
More
Series from Standard & Poors
More
Series from Interest Rate Spreads
More
Series from H.15 Selected Interest Rates
More
Series from Spot Prices
More
Series from Recession Indicators Series
More
Series from Temporary Open Market Operations
More
Series from Existing Home Sales
More
Series from New Residential Sales
More
Series from New Residential Construction
More
Series from Chicago Fed National Financial Conditions Index
More
Series from An Arbitrage-Free Three-Factor Term Structure Model and the Recent Behavior of Long-Term Yields and Distant-Horizon Forward Rates
More
Series from Historical Overnight AMERIBOR Unsecured Interest Rate
Tags
Cash
H.8 Assets & Liabilities of US Commercial Banks
Weekly
Assets
Banks
Depository Institutions
Board of Governors
Seasonally Adjusted
Nation
Public Domain: Citation Requested
United States of America
Swaps
Liquidity
H.4.1 Factors Affecting Reserve Balances
Maturity
Not Seasonally Adjusted
Federal Open Market Committee
Federal Open Markets Committee
Projection
Federal
Median
St. Louis Fed
Rate
Annual
Composite
Stock Market
National Association of Securities Dealers Automated Quotations
Nasdaq, Inc.
Copyrighted: Pre-Approval Required
Daily
Indexes
Copyrighted: Citation Required
S&P
S&P Dow Jones Indices LLC
Yield Curve
Spread
3-Month
10-Year
Treasury
Interest Rate
Interest
H.15 Selected Interest Rates
Inflation
Coins
Currency
West
West Texas Intermediate
Intermediate
Crude
Energy Information Administration
Oil
Commodities
Price
Supplies
Primary
Balance
Reserves
Credits
Loans
Peak
Trough
Recession Indicators
Discontinued
Org. for Economic Co-operation and Development
2-Year
Reverse Repos
Overnight
New York Fed
Trade
Securities
Sales
Existing Home Sales
National Assoc. of Realtors
Inventories
Housing
Monthly
New Residential Sales
1-Unit Structures
Housing and Urban Development
Family
New
Census
Headline Figure
New Residential Construction
Permits
Buildings
Private
Chicago Fed National Financial Conditions Index
Chicago Fed
Adjusted
Financial
Bonds
Yield
American Interbank Offered Rate
American Financial Exchange
Bills