Notes
Source: Sahm, Claudia
Release: Sahm Rule Recession Indicator
Units:
Frequency:
Notes:
Sahm Recession Indicator signals the start of a recession when the three-month moving average of the national unemployment rate (U3) rises by 0.50 percentage points or more relative to the minimum of the three-month averages from the previous 12 months.
This indicator is based on "real-time" data, that is, the unemployment rate (and the recent history of unemployment rates) that were available in a given month. The BLS revises the unemployment rate each year at the beginning of January, when the December unemployment rate for the prior year is published. Revisions to the seasonal factors can affect estimates in recent years. Otherwise the unemployment rate does not revise.
Suggested Citation:
Sahm, Claudia, Real-time Sahm Rule Recession Indicator [SAHMREALTIME], retrieved from FRED, Federal Reserve Bank of St. Louis; https://fred.stlouisfed.org/series/SAHMREALTIME, .
Source: Federal Reserve Bank of St. Louis
Release: Interest Rate Spreads
Units:
Frequency:
Notes:
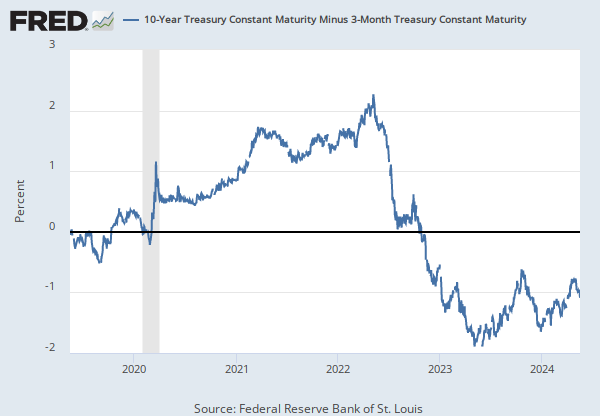
Series is calculated as the spread between 10-Year Treasury Constant Maturity (BC_10YEAR) and 3-Month Treasury Constant Maturity (BC_3MONTH).
Starting with the update on June 21, 2019, the Treasury bond data used in calculating interest rate spreads is obtained directly from the U.S. Treasury Department.
Suggested Citation:
Federal Reserve Bank of St. Louis, 10-Year Treasury Constant Maturity Minus 3-Month Treasury Constant Maturity [T10Y3M], retrieved from FRED, Federal Reserve Bank of St. Louis; https://fred.stlouisfed.org/series/T10Y3M, .
Source: Chauvet, Marcelle
Source: Piger, Jeremy Max
Release: U.S. Recession Probabilities
Units:
Frequency:
Notes:
Smoothed recession probabilities for the United States are obtained from a dynamic-factor markov-switching model applied to four monthly coincident variables: non-farm payroll employment, the index of industrial production, real personal income excluding transfer payments, and real manufacturing and trade sales. This model was originally developed in Chauvet, M., "An Economic Characterization of Business Cycle Dynamics with Factor Structure and Regime Switching," International Economic Review, 1998, 39, 969-996.
For additional details, including an analysis of the performance of this model for dating business cycles in real time, see:
Chauvet, M. and J. Piger, "A Comparison of the Real-Time Performance of Business Cycle Dating Methods," Journal of Business and Economic Statistics, 2008, 26, 42-49.
For additional details as to why this data revises, see FAQ 3.
Suggested Citation:
Chauvet, Marcelle and Piger, Jeremy Max, Smoothed U.S. Recession Probabilities [RECPROUSM156N], retrieved from FRED, Federal Reserve Bank of St. Louis; https://fred.stlouisfed.org/series/RECPROUSM156N, .
Source: Federal Reserve Bank of Chicago
Release: Chicago Fed National Activity Index
Units:
Frequency:
Notes:
A zero value for the index indicates that the national economy is expanding at its historical trend rate of growth; negative values indicate below-average growth; and positive values indicate above-average growth.
For further information, please visit the Federal Reserve Bank of Chicago's web site:
http://www.chicagofed.org/webpages/research/data/cfnai/current_data.cfm
Suggested Citation:
Federal Reserve Bank of Chicago, Chicago Fed National Activity Index: Three Month Moving Average [CFNAIMA3], retrieved from FRED, Federal Reserve Bank of St. Louis; https://fred.stlouisfed.org/series/CFNAIMA3, .
Source: U.S. Employment and Training Administration
Release: Unemployment Insurance Weekly Claims Report
Units:
Frequency:
Notes:
An initial claim is a claim filed by an unemployed individual after a separation from an employer. The claim requests a determination of basic eligibility for the Unemployment Insurance program.
Suggested Citation:
U.S. Employment and Training Administration, Initial Claims [ICSA], retrieved from FRED, Federal Reserve Bank of St. Louis; https://fred.stlouisfed.org/series/ICSA, .
Source: U.S. Bureau of Labor Statistics
Release: Employment Situation
Units:
Frequency:
Notes:
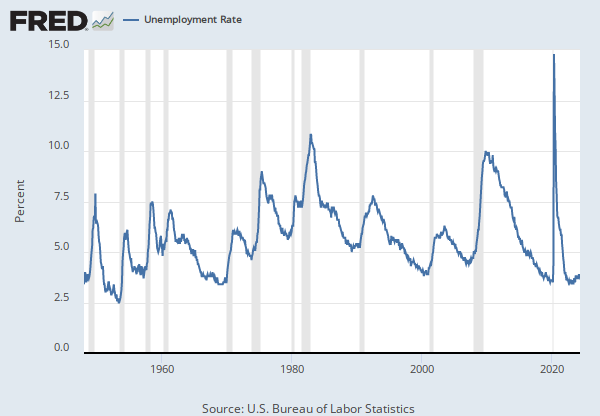
The unemployment rate represents the number of unemployed as a percentage of the labor force. Labor force data are restricted to people 16 years of age and older, who currently reside in 1 of the 50 states or the District of Columbia, who do not reside in institutions (e.g., penal and mental facilities, homes for the aged), and who are not on active duty in the Armed Forces.
This rate is also defined as the U-3 measure of labor underutilization.
The series comes from the 'Current Population Survey (Household Survey)'
The source code is: LNS14000000
Suggested Citation:
U.S. Bureau of Labor Statistics, Unemployment Rate [UNRATE], retrieved from FRED, Federal Reserve Bank of St. Louis; https://fred.stlouisfed.org/series/UNRATE, .
Source: Federal Reserve Bank of St. Louis
Release: Recession Indicators Series
Units:
Frequency:
Notes:
This time series is an interpretation of US Business Cycle Expansions and Contractions data provided by The National Bureau of Economic Research (NBER). Our time series is composed of dummy variables that represent periods of expansion and recession. The NBER identifies months and quarters of turning points without designating a date within the period that turning points occurred. The dummy variable adopts an arbitrary convention that the turning point occurred at a specific date within the period. The arbitrary convention does not reflect any judgment on this issue by the NBER's Business Cycle Dating Committee. A value of 1 is a recessionary period, while a value of 0 is an expansionary period. For this time series, the recession begins the first day of the period following a peak and ends on the last day of the period of the trough. For more options on recession shading, see the notes and links below.
The recession shading data that we provide initially comes from the source as a list of dates that are either an economic peak or trough. We interpret dates into recession shading data using one of three arbitrary methods. All of our recession shading data is available using all three interpretations. The period between a peak and trough is always shaded as a recession. The peak and trough are collectively extrema. Depending on the application, the extrema, both individually and collectively, may be included in the recession period in whole or in part. In situations where a portion of a period is included in the recession, the whole period is deemed to be included in the recession period.
The first interpretation, known as the midpoint method, is to show a recession from the midpoint of the peak through the midpoint of the trough for monthly and quarterly data. For daily data, the recession begins on the 15th of the month of the peak and ends on the 15th of the month of the trough. Daily data is a disaggregation of monthly data. For monthly and quarterly data, the entire peak and trough periods are included in the recession shading. This method shows the maximum number of periods as a recession for monthly and quarterly data. The Federal Reserve Bank of St. Louis uses this method in its own publications. One version of this time series is represented using the midpoint method The second interpretation, known as the trough method, is to show a recession from the period following the peak through the trough (i.e. the peak is not included in the recession shading, but the trough is). For daily data, the recession begins on the first day of the first month following the peak and ends on the last day of the month of the trough. Daily data is a disaggregation of monthly data. The trough method is used when displaying data on FRED graphs. The trough method is used for this series.
The third interpretation, known as the peak method, is to show a recession from the period of the peak to the trough (i.e. the peak is included in the recession shading, but the trough is not). For daily data, the recession begins on the first day of the month of the peak and ends on the last day of the month preceding the trough. Daily data is a disaggregation of monthly data. Here is an example of this time series represented using the peak method.
Suggested Citation:
Federal Reserve Bank of St. Louis, NBER based Recession Indicators for the United States from the Period following the Peak through the Trough [USREC], retrieved from FRED, Federal Reserve Bank of St. Louis; https://fred.stlouisfed.org/series/USREC, .
Release Tables
Employment Situation
- Monthly, Seasonally Adjusted (population data is not adjusted for seasonal variation; not seasonally adjusted version used)
- Table A-10. Selected unemployment indicators, Seasonally adjusted: Monthly, Unemployment Rates
- Table A-15. Alternative measures of labor underutilization: Monthly, Seasonally Adjusted
Unemployment Insurance Weekly Claims Report
Related Data and Content
Data Suggestions Based On Your Search

















Content Suggestions










Other Formats
10-Year Treasury Constant Maturity Minus 3-Month Treasury Constant Maturity
Monthly, Not Seasonally AdjustedInitial Claims
Weekly, Not Seasonally AdjustedUnemployment Rate
Monthly, Not Seasonally AdjustedNBER based Recession Indicators for the United States from the Period following the Peak through the Trough
Daily, Not Seasonally Adjusted Quarterly, Not Seasonally AdjustedRelated Categories
Recession Probabilities
Academic Data
Interest Rate Spreads
Interest Rates
Money, Banking, & Finance
Financial Activity Measures
Financial Indicators
Weekly Initial Claims
Population, Employment, & Labor Markets
Unemployment Rate
Current Population Survey (Household Survey)
Business Cycle Expansions & Contractions
Production & Business Activity
Releases
More
Series from Sahm Rule Recession Indicator
More
Series from Interest Rate Spreads
More
Series from U.S. Recession Probabilities
More
Series from Chicago Fed National Activity Index
More
Series from Unemployment Insurance Weekly Claims Report
More
Series from Employment Situation
More
Series from Recession Indicators Series
Tags
Claudia Sahm
Recession Indicators
Academic Data
Seasonally Adjusted
Monthly
Nation
Public Domain: Citation Requested
United States of America
Yield Curve
Spread
3-Month
10-Year
Maturity
Treasury
Interest Rate
St. Louis Fed
Interest
Daily
Rate
Copyrighted: Citation Required
Not Seasonally Adjusted
Chauvet, Marcelle
Marcelle M. Chauvet and Jeremy Piger
Chicago Fed National Activity Index
Moving Average
Chicago Fed
Average
Indexes
Initial Claims
Employment and Training Administration
Headline Figure
Weekly
Labor Underutilization
Civilian
16 Years +
Labor
Current Population Survey (Household Survey)
Unemployment
Bureau of Labor Statistics
Peak
Trough
National Bureau of Economic Research