Notes
Source: U.S. Federal Open Market Committee
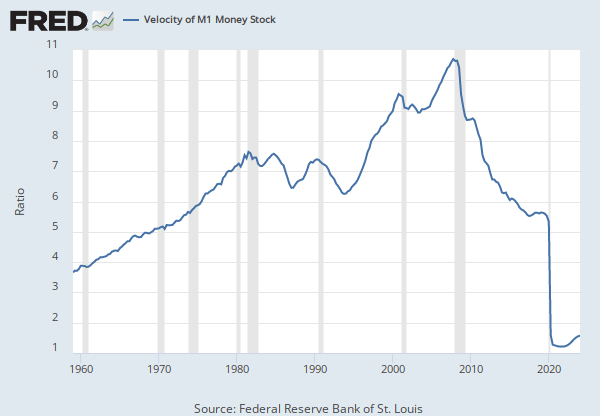
Source: Federal Reserve Bank of St. Louis
Release: Summary of Economic Projections
Units:
Frequency:
Notes:
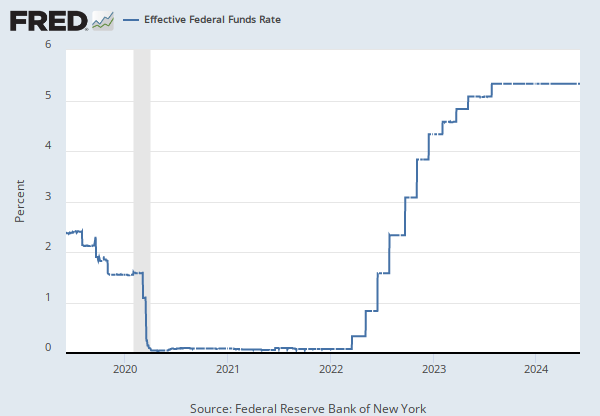
The projections for the federal funds rate are the value of the midpoint of the projected appropriate target range for the federal funds rate or the projected appropriate target level for the federal funds rate at the end of the specified calendar year or over the longer run. Each participant's projections are based on his or her assessment of appropriate monetary policy. The range for each variable in a given year includes all participants' projections, from lowest to highest, for that variable in the given year. This series represents the median value of the range forecast established by the Federal Open Market Committee. For each period, the median is the middle projection when the projections are arranged from lowest to highest. When the number of projections is even, the median is the average of the two middle projections.
Digitized originals of this release can be found at https://fraser.stlouisfed.org/publication/?pid=677.
Suggested Citation:
U.S. Federal Open Market Committee and Federal Reserve Bank of St. Louis, FOMC Summary of Economic Projections for the Fed Funds Rate, Median [FEDTARMD], retrieved from FRED, Federal Reserve Bank of St. Louis; https://fred.stlouisfed.org/series/FEDTARMD, .
Source: U.S. Federal Open Market Committee
Source: Federal Reserve Bank of St. Louis
Release: Summary of Economic Projections
Units:
Frequency:
Notes:
Projections of real gross domestic product growth are fourth-quarter growth rates, that is, percentage changes from the fourth quarter of the prior year to the fourth quarter of the indicated year. Each participant's projections are based on his or her assessment of appropriate monetary policy. The range for each variable in a given year includes all participants' projections, from lowest to highest, for that variable in the given year; the central tendencies exclude the three highest and three lowest projections for each year. This series represents the midpoint of the central tendency forecast's high and low values established by the Federal Open Market Committee.
Digitized originals of this release can be found at https://fraser.stlouisfed.org/publication/?pid=677.
Suggested Citation:
U.S. Federal Open Market Committee and Federal Reserve Bank of St. Louis, FOMC Summary of Economic Projections for the Growth Rate of Real Gross Domestic Product, Central Tendency, Midpoint [GDPC1CTM], retrieved from FRED, Federal Reserve Bank of St. Louis; https://fred.stlouisfed.org/series/GDPC1CTM, .
Source: U.S. Federal Open Market Committee
Source: Federal Reserve Bank of St. Louis
Release: Summary of Economic Projections
Units:
Frequency:
Notes:
Projections for the unemployment rate are for the average civilian unemployment rate in the fourth quarter of each year. Each participant's projections are based on his or her assessment of appropriate monetary policy. The range for each variable in a given year includes all participants' projections, from lowest to highest, for that variable in the given year. This series represents the median value of the range forecast established by the Federal Open Market Committee. For each period, the median is the middle projection when the projections are arranged from lowest to highest. When the number of projections is even, the median is the average of the two middle projections.
Digitized originals of this release can be found at https://fraser.stlouisfed.org/publication/?pid=677.
Suggested Citation:
U.S. Federal Open Market Committee and Federal Reserve Bank of St. Louis, FOMC Summary of Economic Projections for the Civilian Unemployment Rate, Median [UNRATEMD], retrieved from FRED, Federal Reserve Bank of St. Louis; https://fred.stlouisfed.org/series/UNRATEMD, .
Source: Nasdaq, Inc.
Release: Nasdaq Daily Index Data
Units:
Frequency:
Notes:
The observations for the NASDAQ Composite Index represent the daily index value at market close. The market typically closes at 4 PM ET, except for holidays when it sometimes closes early.
The NASDAQ Composite Index is a market capitalization weighted index with more than 3000 common equities listed on the NASDAQ Stock Market. The types of securities in the index include American depositary receipts (ADRs), common stocks, real estate investment trusts (REITs), and tracking stocks. The index includes all NASDAQ listed stocks that are not derivatives, preferred shares, funds, exchange-traded funds (ETFs) or debentures.
Copyright © 2016, NASDAQ OMX Group, Inc.
Suggested Citation:
Nasdaq, Inc., NASDAQ Composite [NASDAQCOM], retrieved from FRED, Federal Reserve Bank of St. Louis; https://fred.stlouisfed.org/series/NASDAQCOM, .
Source: S&P Dow Jones Indices LLC
Release: Standard & Poors
Units:
Frequency:
Notes:
The observations for the S&P 500 represent the daily index value at market close. The market typically closes at 4 PM ET, except for holidays when it sometimes closes early.
The Federal Reserve Bank of St. Louis and S&P Dow Jones Indices LLC have reached a new agreement on the use of Standard & Poors and Dow Jones Averages series in FRED. FRED and its associated services will include 10 years of daily history for Standard & Poors and Dow Jones Averages series.
The S&P 500 is regarded as a gauge of the large cap U.S. equities market. The index includes 500 leading companies in leading industries of the U.S. economy, which are publicly held on either the NYSE or NASDAQ, and covers 75% of U.S. equities. Since this is a price index and not a total return index, the S&P 500 index here does not contain dividends.
Copyright © 2016, S&P Dow Jones Indices LLC. All rights reserved. Reproduction of S&P 500 in any form is prohibited except with the prior written permission of S&P Dow Jones Indices LLC ("S&P"). S&P does not guarantee the accuracy, adequacy, completeness or availability of any information and is not responsible for any errors or omissions, regardless of the cause or for the results obtained from the use of such information. S&P DISCLAIMS ANY AND ALL EXPRESS OR IMPLIED WARRANTIES, INCLUDING, BUT NOT LIMITED TO, ANY WARRANTIES OF MERCHANTABILITY OR FITNESS FOR A PARTICULAR PURPOSE OR USE. In no event shall S&P be liable for any direct, indirect, special or consequential damages, costs, expenses, legal fees, or losses (including lost income or lost profit and opportunity costs) in connection with subscriber's or others' use of S&P 500.
Permission to reproduce S&P 500 can be requested from index_services@spdji.com. More contact details are available here, including phone numbers for all regional offices.
Suggested Citation:
S&P Dow Jones Indices LLC, S&P 500 [SP500], retrieved from FRED, Federal Reserve Bank of St. Louis; https://fred.stlouisfed.org/series/SP500, .
Source: Nikkei Industry Research Institute
Release: Nikkei Indexes
Units:
Frequency:
Notes:
The observations for the Nikkei Stock Average, Nikkei 225 represent the daily index value at market close.
Nikkei 225 is the major stock market index comprising of 225 highly liquid stocks of the Tokyo Stock Exchange (TSE).
For in depth information, visit here.
Copyright, 2016, Nikkei Inc. Reprinted with permission.
Downloading the data for research reports or research projects is permitted.
However, if you wish to redistribute the data itself or research reports (information with Nikkei data) to the third parties/persons, the user shall report back to the Nikkei, Inc for permission.
Suggested Citation:
Nikkei Industry Research Institute, Nikkei Stock Average, Nikkei 225 [NIKKEI225], retrieved from FRED, Federal Reserve Bank of St. Louis; https://fred.stlouisfed.org/series/NIKKEI225, .
Source: Board of Governors of the Federal Reserve System (US)
Release: H.10 Foreign Exchange Rates
Units:
Frequency:
Notes:
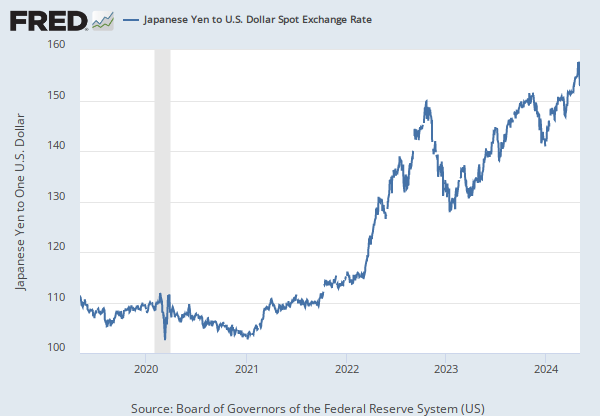
Noon buying rates in New York City for cable transfers payable in foreign currencies.
For questions on the data, please contact the data source. For questions on FRED functionality, please contact us here.
Suggested Citation:
Board of Governors of the Federal Reserve System (US), Japanese Yen to U.S. Dollar Spot Exchange Rate [DEXJPUS], retrieved from FRED, Federal Reserve Bank of St. Louis; https://fred.stlouisfed.org/series/DEXJPUS, .
Source: Board of Governors of the Federal Reserve System (US)
Release: H.4.1 Factors Affecting Reserve Balances
Units:
Frequency:
Notes:
For questions on the data, please contact the data source. For questions on FRED functionality, please contact us here.
Suggested Citation:
Board of Governors of the Federal Reserve System (US), Assets: Liquidity and Credit Facilities: Loans: Primary Credit: Wednesday Level [WLCFLPCL], retrieved from FRED, Federal Reserve Bank of St. Louis; https://fred.stlouisfed.org/series/WLCFLPCL, .
Source: Board of Governors of the Federal Reserve System (US)
Release: H.4.1 Factors Affecting Reserve Balances
Units:
Frequency:
Notes:
For questions on the data, please contact the data source. For questions on FRED functionality, please contact us here.
Suggested Citation:
Board of Governors of the Federal Reserve System (US), Assets: Central Bank Liquidity Swaps: Central Bank Liquidity Swaps: Wednesday Level [SWPT], retrieved from FRED, Federal Reserve Bank of St. Louis; https://fred.stlouisfed.org/series/SWPT, .
Source: Board of Governors of the Federal Reserve System (US)
Release: H.4.1 Factors Affecting Reserve Balances
Units:
Frequency:
Notes:
For questions on the data, please contact the data source. For questions on FRED functionality, please contact us here.
Suggested Citation:
Board of Governors of the Federal Reserve System (US), Assets: Liquidity and Credit Facilities: Loans: Bank Term Funding Program, Net: Wednesday Level [H41RESPPALDKNWW], retrieved from FRED, Federal Reserve Bank of St. Louis; https://fred.stlouisfed.org/series/H41RESPPALDKNWW, .
Source: Board of Governors of the Federal Reserve System (US)
Release: H.4.1 Factors Affecting Reserve Balances
Units:
Frequency:
Notes:
For questions on the data, please contact the data source. For questions on FRED functionality, please contact us here.
Suggested Citation:
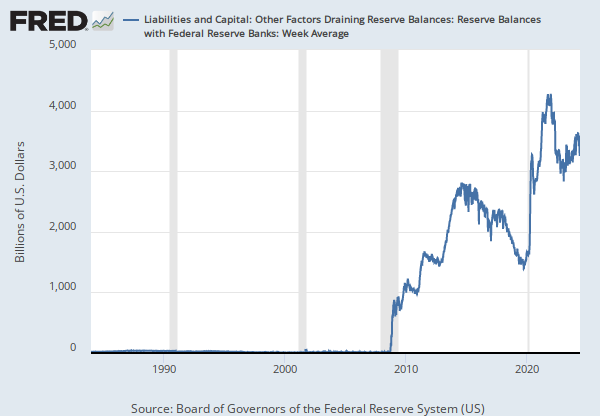
Board of Governors of the Federal Reserve System (US), Liabilities and Capital: Other Factors Draining Reserve Balances: Currency in Circulation: Week Average [WCURCIR], retrieved from FRED, Federal Reserve Bank of St. Louis; https://fred.stlouisfed.org/series/WCURCIR, .
Source: Ice Data Indices, LLC
Release: ICE BofA Indices
Units:
Frequency:
Notes:
Starting in April 2026, this series will only include 3 years of observations. For more data, go to the source.
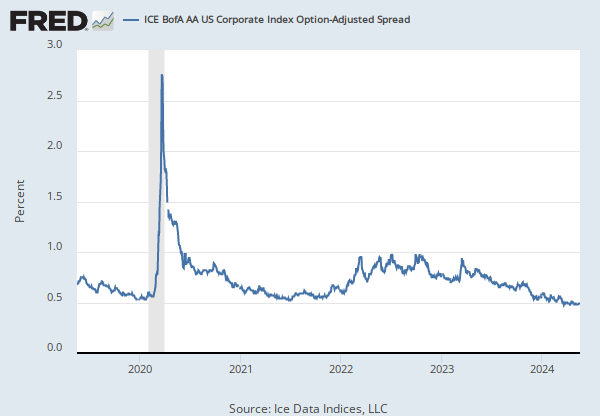
This data represents the Option-Adjusted Spread (OAS) of the ICE BofA US Corporate C Index, a subset of the ICE BofA US High Yield Master II Index tracking the performance of US dollar denominated below investment grade rated corporate debt publicly issued in the US domestic market. This subset includes all securities with a given investment grade rating CCC or below.
The ICE BofA OASs are the calculated spreads between a computed OAS index of all bonds in a given rating category and a spot Treasury curve. An OAS index is constructed using each constituent bond's OAS, weighted by market capitalization. When the last calendar day of the month takes place on the weekend, weekend observations will occur as a result of month ending accrued interest adjustments.
Certain indices and index data included in FRED are the property of ICE Data Indices, LLC (“ICE DATA”) and used under license. ICE® IS A REGISTERED TRADEMARK OF ICE DATA OR ITS AFFILIATES AND BOFA® IS A REGISTERED TRADEMARK OF BANK OF AMERICA CORPORATION LICENSED BY BANK OF AMERICA CORPORATION AND ITS AFFILIATES (“BOFA”) AND MAY NOT BE USED WITHOUT BOFA’S PRIOR WRITTEN APPROVAL. ICE DATA, ITS AFFILIATES AND THEIR RESPECTIVE THIRD PARTY SUPPLIERS DISCLAIM ANY AND ALL WARRANTIES AND REPRESENTATIONS, EXPRESS AND/OR IMPLIED, INCLUDING ANY WARRANTIES OF MERCHANTABILITY OR FITNESS FOR A PARTICULAR PURPOSE OR USE, INCLUDING WITH REGARD TO THE INDICES, INDEX DATA AND ANY DATA INCLUDED IN, RELATED TO, OR DERIVED THEREFROM. NEITHER ICE DATA, NOR ITS AFFILIATES OR THEIR RESPECTIVE THIRD PARTY PROVIDERS SHALL BE SUBJECT TO ANY DAMAGES OR LIABILITY WITH RESPECT TO THE ADEQUACY, ACCURACY, TIMELINESS OR COMPLETENESS OF THE INDICES OR THE INDEX DATA OR ANY COMPONENT THEREOF. THE INDICES AND INDEX DATA AND ALL COMPONENTS THEREOF ARE PROVIDED ON AN “AS IS” BASIS AND YOUR USE IS AT YOUR OWN RISK. ICE DATA, ITS AFFILIATES AND THEIR RESPECTIVE THIRD PARTY SUPPLIERS DO NOT SPONSOR, ENDORSE, OR RECOMMEND FRED, OR ANY OF ITS PRODUCTS OR SERVICES.
Copyright, 2023, ICE Data Indices. Reproduction of this data in any form is prohibited except with the prior written permission of ICE Data Indices.
The end of day Index values, Index returns, and Index statistics (“Top Level Data”) are being provided for your internal use only and you are not authorized or permitted to publish, distribute or otherwise furnish Top Level Data to any third-party without prior written approval of ICE Data.
Neither ICE Data, its affiliates nor any of its third party suppliers shall have any liability for the accuracy or completeness of the Top Level Data furnished through FRED, or for delays, interruptions or omissions therein nor for any lost profits, direct, indirect, special or consequential damages.
The Top Level Data is not investment advice and a reference to a particular investment or security, a credit rating or any observation concerning a security or investment provided in the Top Level Data is not a recommendation to buy, sell or hold such investment or security or make any other investment decisions.
You shall not use any Indices as a reference index for the purpose of creating financial products (including but not limited to any exchange-traded fund or other passive index-tracking fund, or any other financial instrument whose objective or return is linked in any way to any Index) without prior written approval of ICE Data.
ICE Data, their affiliates or their third party suppliers have exclusive proprietary rights in the Top Level Data and any information and software received in connection therewith.
You shall not use or permit anyone to use the Top Level Data for any unlawful or unauthorized purpose.
Access to the Top Level Data is subject to termination in the event that any agreement between FRED and ICE Data terminates for any reason.
ICE Data may enforce its rights against you as the third-party beneficiary of the FRED Services Terms of Use, even though ICE Data is not a party to the FRED Services Terms of Use.
The FRED Services Terms of Use, including but limited to the limitation of liability, indemnity and disclaimer provisions, shall extend to third party suppliers.
Suggested Citation:
Ice Data Indices, LLC, ICE BofA CCC & Lower US High Yield Index Option-Adjusted Spread [BAMLH0A3HYC], retrieved from FRED, Federal Reserve Bank of St. Louis; https://fred.stlouisfed.org/series/BAMLH0A3HYC, .
Source: U.S. Bureau of Labor Statistics
Release: Consumer Price Index
Units:
Frequency:
Notes:
The Consumer Price Index for All Urban Consumers: All Items (CPIAUCSL) is a price index of a basket of goods and services paid by urban consumers. Percent changes in the price index measure the inflation rate between any two time periods. The most common inflation metric is the percent change from one year ago. It can also represent the buying habits of urban consumers. This particular index includes roughly 88 percent of the total population, accounting for wage earners, clerical workers, technical workers, self-employed, short-term workers, unemployed, retirees, and those not in the labor force.
The CPIs are based on prices for food, clothing, shelter, and fuels; transportation fares; service fees (e.g., water and sewer service); and sales taxes. Prices are collected monthly from about 4,000 housing units and approximately 26,000 retail establishments across 87 urban areas. To calculate the index, price changes are averaged with weights representing their importance in the spending of the particular group. The index measures price changes (as a percent change) from a predetermined reference date. In addition to the original unadjusted index distributed, the Bureau of Labor Statistics also releases a seasonally adjusted index. The unadjusted series reflects all factors that may influence a change in prices. However, it can be very useful to look at the seasonally adjusted CPI, which removes the effects of seasonal changes, such as weather, school year, production cycles, and holidays.
The CPI can be used to recognize periods of inflation and deflation. Significant increases in the CPI within a short time frame might indicate a period of inflation, and significant decreases in CPI within a short time frame might indicate a period of deflation. However, because the CPI includes volatile food and oil prices, it might not be a reliable measure of inflationary and deflationary periods. For a more accurate detection, the core CPI (CPILFESL) is often used. When using the CPI, please note that it is not applicable to all consumers and should not be used to determine relative living costs. Additionally, the CPI is a statistical measure vulnerable to sampling error since it is based on a sample of prices and not the complete average.
For more information on the CPI, see the Handbook of Methods, the release notes and announcements, and the Frequently Asked Questions (FAQs).
Suggested Citation:
U.S. Bureau of Labor Statistics, Consumer Price Index for All Urban Consumers: All Items in U.S. City Average [CPIAUCSL], retrieved from FRED, Federal Reserve Bank of St. Louis; https://fred.stlouisfed.org/series/CPIAUCSL, .
Source: Federal Reserve Bank of Chicago
Release: Chicago Fed National Financial Conditions Index
Units:
Frequency:
Notes:
The Chicago Fed’s National Financial Conditions Index (NFCI) provides a comprehensive weekly update on U.S. financial conditions in money markets, debt and equity markets and the traditional and “shadow” banking systems. Positive values of the NFCI indicate financial conditions that are tighter than average, while negative values indicate financial conditions that are looser than average.
The adjusted NFCI (ANFCI). This index isolates a component of financial conditions uncorrelated with economic conditions to provide an update on how financial conditions compare with current economic conditions.
For further information, please visit the Federal Reserve Bank of Chicago's web site: http://www.chicagofed.org/webpages/publications/nfci/index.cfm
Suggested Citation:
Federal Reserve Bank of Chicago, Chicago Fed Adjusted National Financial Conditions Index [ANFCI], retrieved from FRED, Federal Reserve Bank of St. Louis; https://fred.stlouisfed.org/series/ANFCI, .
Source: Chicago Board Options Exchange
Release: CBOE Market Statistics
Units:
Frequency:
Notes:
Copyright, 2016, Chicago Board Options Exchange, Inc. Reprinted with permission.
Suggested Citation:
Chicago Board Options Exchange, CBOE Russell 2000 Volatility Index [RVXCLS], retrieved from FRED, Federal Reserve Bank of St. Louis; https://fred.stlouisfed.org/series/RVXCLS, .
Source: S&P Dow Jones Indices LLC
Release: S&P Cotality Case-Shiller Home Price Indices
Units:
Frequency:
Notes:
For more information regarding the index, please visit Standard & Poor's. There is more information about home price sales pairs in the Methodology section. Copyright, 2016, Standard & Poor's Financial Services LLC. Reprinted with permission.
Suggested Citation:
S&P Dow Jones Indices LLC, S&P Cotality Case-Shiller U.S. National Home Price Index [CSUSHPINSA], retrieved from FRED, Federal Reserve Bank of St. Louis; https://fred.stlouisfed.org/series/CSUSHPINSA, .
Source: Federal Reserve Bank of St. Louis
Release: Real Money Stock Measures
Units:
Frequency:
Notes:
This series deflates M2 money stock (https://fred.stlouisfed.org/series/M2SL) with CPI (https://fred.stlouisfed.org/series/CPIAUCSL).
Suggested Citation:
Federal Reserve Bank of St. Louis, Real M2 Money Stock [M2REAL], retrieved from FRED, Federal Reserve Bank of St. Louis; https://fred.stlouisfed.org/series/M2REAL, .
Source: Board of Governors of the Federal Reserve System (US)
Release: Z.1 Financial Accounts of the United States
Units:
Frequency:
Notes:
For more information about the Flow of Funds tables, see the Financial Accounts Guide.
With each quarterly release, the source may make major data and structural revisions to the series and tables. These changes are available in the Release Highlights.
In the Financial Accounts, the source identifies each series by a string of patterned letters and numbers. For a detailed description, including how this series is constructed, see the series analyzer provided by the source.
Suggested Citation:
Board of Governors of the Federal Reserve System (US), Money Market Funds; Total Financial Assets, Level [MMMFFAQ027S], retrieved from FRED, Federal Reserve Bank of St. Louis; https://fred.stlouisfed.org/series/MMMFFAQ027S, .
Source: Board of Governors of the Federal Reserve System (US)
Release: Senior Loan Officer Opinion Survey on Bank Lending Practices
Units:
Frequency:
Notes:
This data series is part of the Board of Governors of the Federal Reserve System's Senior Loan Officer Opinion Survey on Bank Lending Practices (SLOOS). The purpose of the survey is to provide qualitative and limited quantitative information on bank credit availability and loan demand, as well as on evolving developments and lending practices in the U.S. loan markets. A portion of each survey typically covers special topics of timely interest.
For questions on the data, please contact the data source. For questions on FRED functionality, please contact us here.
Suggested Citation:
Board of Governors of the Federal Reserve System (US), Net Percentage of Domestic Banks Tightening Standards for Commercial and Industrial Loans to Large and Middle-Market Firms [DRTSCILM], retrieved from FRED, Federal Reserve Bank of St. Louis; https://fred.stlouisfed.org/series/DRTSCILM, .
Source: Automatic Data Processing, Inc.
Release: ADP National Employment Report
Units:
Frequency:
Notes:
The current year’s January report reflects the scheduled annual revision of the ADP National Employment Report (NER). The data series has been reweighted to match annual Quarterly Census of Employment and Wages (QCEW) benchmark data through March of the previous year. This is a recurring process that happens every year in February and is a common practice for reports of this nature. More information about this report can be found at ADP National Employment Report website.
Suggested Citation:
Automatic Data Processing, Inc., Nonfarm Private Employment in Small Establishments with 1 to 19 Employees [ADPWES1T19ENERSA], retrieved from FRED, Federal Reserve Bank of St. Louis; https://fred.stlouisfed.org/series/ADPWES1T19ENERSA, .
Source: U.S. Bureau of Labor Statistics
Release: State Employment and Unemployment
Units:
Frequency:
Suggested Citation:
U.S. Bureau of Labor Statistics, Unemployment Rate in California [CAUR], retrieved from FRED, Federal Reserve Bank of St. Louis; https://fred.stlouisfed.org/series/CAUR, .
Source: U.S. Bureau of Labor Statistics
Release: Employment Situation
Units:
Frequency:
Notes:
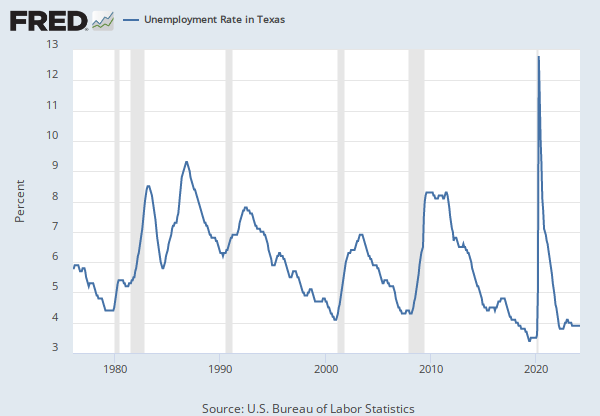
The unemployment rate represents the number of unemployed as a percentage of the labor force. Labor force data are restricted to people 16 years of age and older, who currently reside in 1 of the 50 states or the District of Columbia, who do not reside in institutions (e.g., penal and mental facilities, homes for the aged), and who are not on active duty in the Armed Forces.
This rate is also defined as the U-3 measure of labor underutilization.
The series comes from the 'Current Population Survey (Household Survey)'
The source code is: LNS14000000
Suggested Citation:
U.S. Bureau of Labor Statistics, Unemployment Rate [UNRATE], retrieved from FRED, Federal Reserve Bank of St. Louis; https://fred.stlouisfed.org/series/UNRATE, .
Release Tables
ADP National Employment Report
Consumer Price Index
Employment Situation
- Monthly, Seasonally Adjusted (population data is not adjusted for seasonal variation; not seasonally adjusted version used)
- Table A-10. Selected unemployment indicators, Seasonally adjusted: Monthly, Unemployment Rates
- Table A-15. Alternative measures of labor underutilization: Monthly, Seasonally Adjusted
H.10 Foreign Exchange Rates
H.4.1 Factors Affecting Reserve Balances
- Table 1. Factors Affecting Reserve Balances of Depository Institutions: Wednesday Level
- Table 1. Factors Affecting Reserve Balances of Depository Institutions: Week Average
- Table 2. Maturity Distribution of Securities, Loans, and Selected Other Assets and Liabilities
- Table 5. Consolidated Statement of Condition of All Federal Reserve Banks
- Table 6. Statement of Condition of Each Federal Reserve Bank
S&P Cotality Case-Shiller Home Price Indices
State Employment and Unemployment
Summary of Economic Projections
Z.1 Financial Accounts of the United States
Related Data and Content
Data Suggestions Based On Your Search


Content Suggestions


Other Formats
Japanese Yen to U.S. Dollar Spot Exchange Rate
Annual, Not Seasonally Adjusted Monthly, Not Seasonally AdjustedConsumer Price Index for All Urban Consumers: All Items in U.S. City Average
Monthly, Not Seasonally Adjusted Semiannual, Not Seasonally AdjustedS&P Cotality Case-Shiller U.S. National Home Price Index
Monthly, Seasonally AdjustedMoney Market Funds; Total Financial Assets, Level
Annual, Not Seasonally AdjustedNonfarm Private Employment in Small Establishments with 1 to 19 Employees
Monthly, Not Seasonally Adjusted Monthly, Seasonally Adjusted Weekly, Not Seasonally AdjustedUnemployment Rate in California
Annual, Not Seasonally Adjusted Monthly, Not Seasonally AdjustedUnemployment Rate
Monthly, Not Seasonally AdjustedRelated Categories
FRB Rates - discount, fed funds, primary credit
Interest Rates
Money, Banking, & Finance
GDP/GNP
National Income & Product Accounts
National Accounts
Unemployment Rate
Current Population Survey (Household Survey)
Population, Employment, & Labor Markets
Stock Market Indexes
Financial Indicators
Stock Market Data
Financial Indicators
Money, Banking, & Finance
Indicators
Japan
Countries
International Data
Japan
By Country
Daily Rates
Exchange Rates
Factors Affecting Reserve Balances
Monetary Data
Securities, Loans, & Other Assets & Liabilities Held by Fed
Corporate Bonds
Consumer Price Indexes (CPI and PCE)
Prices
Financial Activity Measures
Volatility Indexes
House Price Indexes
M2 and Components
S.6 Financial Business
Flow of Funds
Senior Loan Officer Survey
Banking
ADP Employment
California
States
U.S. Regional Data
Releases
More
Series from Summary of Economic Projections
More
Series from Nasdaq Daily Index Data
More
Series from Standard & Poors
More
Series from Nikkei Indexes
More
Series from H.10 Foreign Exchange Rates
More
Series from H.4.1 Factors Affecting Reserve Balances
More
Series from ICE BofA Indices
More
Series from Consumer Price Index
More
Series from Chicago Fed National Financial Conditions Index
More
Series from CBOE Market Statistics
More
Series from S&P Cotality Case-Shiller Home Price Indices
More
Series from Real Money Stock Measures
More
Series from Z.1 Financial Accounts of the United States
More
Series from Senior Loan Officer Opinion Survey on Bank Lending Practices
More
Series from ADP National Employment Report
More
Series from State Employment and Unemployment
More
Series from Employment Situation
Tags
Federal Open Market Committee
Federal Open Markets Committee
Projection
Federal
Median
St. Louis Fed
Rate
Annual
Nation
Public Domain: Citation Requested
United States of America
Not Seasonally Adjusted
Real
Board of Governors
Gross Domestic Product
Civilian
Unemployment
Composite
Stock Market
National Association of Securities Dealers Automated Quotations
Nasdaq, Inc.
Copyrighted: Pre-Approval Required
Daily
Indexes
Copyrighted: Citation Required
S&P
S&P Dow Jones Indices LLC
Nikkei Inc.
Stocks
Japan
H.10 Foreign Exchange Rates
Exchange Rate
Currency
Primary
Supplies
Balance
H.4.1 Factors Affecting Reserve Balances
Reserves
Credits
Loans
Weekly
Depository Institutions
Swaps
Liquidity
Maturity
Banks
Bank Term Funding Program
Program
Funds
Net
Assets
Coins
CCC Bond Rating
Option-Adjusted Spread
BofA Merrill Lynch
BofA Merrill Lynch
Ice Data Indices, Llc
Yield
Interest Rate
Interest
Headline Figure
Average
All Items
Urban
Consumer
Consumer Price Index
Inflation
Price Index
Seasonally Adjusted
Price
Bureau of Labor Statistics
Monthly
Chicago Fed National Financial Conditions Index
Chicago Fed
Adjusted
Financial
Volatility Index
Chicago Board Options Exchange
Volatility
S&P Cotality Case-Shiller Home Price Indices
House Price Index
Housing
M2 Money Stock
Monetary Aggregates
Money Market Mutual Fund
Integrated Macroeconomic Accounts
Z.1 US Financial Accounts
Quarterly
Tightening Standards
Senior Loan Officer Surv. on Bank Lending
Commercial
Domestic
Percent
Industry
1 to 19
Automatic Data Processing, Inc.
Small
Establishments
Nonfarm
Private
Employment
California
State
Labor Underutilization
16 Years +
Current Population Survey (Household Survey)
Labor