Notes
Source: Board of Governors of the Federal Reserve System (US)
Release: H.4.1 Factors Affecting Reserve Balances
Units:
Frequency:
Notes:
For questions on the data, please contact the data source. For questions on FRED functionality, please contact us here.
Suggested Citation:
Board of Governors of the Federal Reserve System (US), Assets: Liquidity and Credit Facilities: Loans: Wednesday Level [WLCFLL], retrieved from FRED, Federal Reserve Bank of St. Louis; https://fred.stlouisfed.org/series/WLCFLL, .
Source: Board of Governors of the Federal Reserve System (US)
Release: H.4.1 Factors Affecting Reserve Balances
Units:
Frequency:
Notes:
For questions on the data, please contact the data source. For questions on FRED functionality, please contact us here.
Suggested Citation:
Board of Governors of the Federal Reserve System (US), Assets: Liquidity and Credit Facilities: Loans: Primary Credit: Wednesday Level [WLCFLPCL], retrieved from FRED, Federal Reserve Bank of St. Louis; https://fred.stlouisfed.org/series/WLCFLPCL, .
Source: Board of Governors of the Federal Reserve System (US)
Release: H.4.1 Factors Affecting Reserve Balances
Units:
Frequency:
Notes:
For questions on the data, please contact the data source. For questions on FRED functionality, please contact us here.
Suggested Citation:
Board of Governors of the Federal Reserve System (US), Assets: Central Bank Liquidity Swaps: Central Bank Liquidity Swaps: Wednesday Level [SWPT], retrieved from FRED, Federal Reserve Bank of St. Louis; https://fred.stlouisfed.org/series/SWPT, .
Source: Board of Governors of the Federal Reserve System (US)
Release: H.4.1 Factors Affecting Reserve Balances
Units:
Frequency:
Notes:
For questions on the data, please contact the data source. For questions on FRED functionality, please contact us here.
Suggested Citation:
Board of Governors of the Federal Reserve System (US), Assets: Liquidity and Credit Facilities: Loans: Bank Term Funding Program, Net: Wednesday Level [H41RESPPALDKNWW], retrieved from FRED, Federal Reserve Bank of St. Louis; https://fred.stlouisfed.org/series/H41RESPPALDKNWW, .
Source: Board of Governors of the Federal Reserve System (US)
Release: H.4.1 Factors Affecting Reserve Balances
Units:
Frequency:
Notes:
For questions on the data, please contact the data source. For questions on FRED functionality, please contact us here.
Suggested Citation:
Board of Governors of the Federal Reserve System (US), Assets: Liquidity and Credit Facilities: Loans: Other Credit Extensions: Wednesday Level [WLCFOCEL], retrieved from FRED, Federal Reserve Bank of St. Louis; https://fred.stlouisfed.org/series/WLCFOCEL, .
Source: Nikkei Industry Research Institute
Release: Nikkei Indexes
Units:
Frequency:
Notes:
The observations for the Nikkei Stock Average, Nikkei 225 represent the daily index value at market close.
Nikkei 225 is the major stock market index comprising of 225 highly liquid stocks of the Tokyo Stock Exchange (TSE).
For in depth information, visit here.
Copyright, 2016, Nikkei Inc. Reprinted with permission.
Downloading the data for research reports or research projects is permitted.
However, if you wish to redistribute the data itself or research reports (information with Nikkei data) to the third parties/persons, the user shall report back to the Nikkei, Inc for permission.
Suggested Citation:
Nikkei Industry Research Institute, Nikkei Stock Average, Nikkei 225 [NIKKEI225], retrieved from FRED, Federal Reserve Bank of St. Louis; https://fred.stlouisfed.org/series/NIKKEI225, .
Source: S&P Dow Jones Indices LLC
Release: Dow Jones Averages
Units:
Frequency:
Notes:
The observations for the Dow Jones Transportation Average represent the daily index value at market close. The market typically closes at 4 PM ET, except for holidays when it sometimes closes early.
Originally made up of only railroad stocks, the Dow Jones Transportation Average now provides a view of the 20 transportation companies in US stock market. For more information, please visit Dow Jones Transportation Average.
Copyright © 2016, S&P Dow Jones Indices LLC. All rights reserved. Reproduction of Dow Jones Transportation Average in any form is prohibited except with the prior written permission of S&P Dow Jones Indices LLC (S&P). S&P does not guarantee the accuracy, adequacy, completeness or availability of any information and is not responsible for any errors or omissions, regardless of the cause or for the results obtained from the use of such information. S&P DISCLAIMS ANY AND ALL EXPRESS OR IMPLIED WARRANTIES, INCLUDING, BUT NOT LIMITED TO, ANY WARRANTIES OF MERCHANTABILITY OR FITNESS FOR A PARTICULAR PURPOSE OR USE. In no event shall S&P be liable for any direct, indirect, special or consequential damages, costs, expenses, legal fees, or losses (including lost income or lost profit and opportunity costs) in connection with subscriber's or others' use of Dow Jones Transportation Average.
Permission to reproduce this series can be requested from index_services@spdji.com. More contact details are available here, including phone numbers for all regional offices.
Suggested Citation:
S&P Dow Jones Indices LLC, Dow Jones Transportation Average [DJTA], retrieved from FRED, Federal Reserve Bank of St. Louis; https://fred.stlouisfed.org/series/DJTA, .
Source: Board of Governors of the Federal Reserve System (US)
Release: H.10 Foreign Exchange Rates
Units:
Frequency:
Notes:
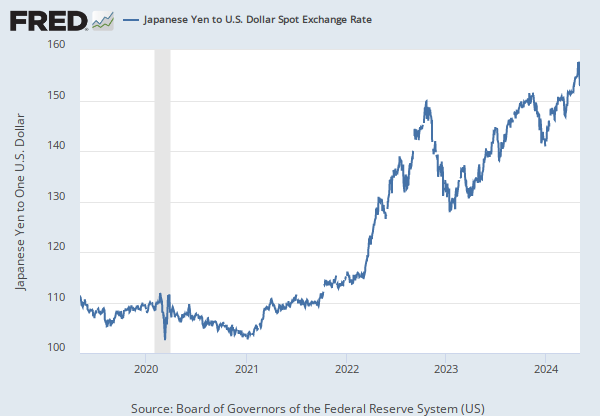
Noon buying rates in New York City for cable transfers payable in foreign currencies.
For questions on the data, please contact the data source. For questions on FRED functionality, please contact us here.
Suggested Citation:
Board of Governors of the Federal Reserve System (US), Japanese Yen to U.S. Dollar Spot Exchange Rate [DEXJPUS], retrieved from FRED, Federal Reserve Bank of St. Louis; https://fred.stlouisfed.org/series/DEXJPUS, .
Source: Nasdaq, Inc.
Release: Nasdaq Daily Index Data
Units:
Frequency:
Notes:
The observations for the NASDAQ Composite Index represent the daily index value at market close. The market typically closes at 4 PM ET, except for holidays when it sometimes closes early.
The NASDAQ Composite Index is a market capitalization weighted index with more than 3000 common equities listed on the NASDAQ Stock Market. The types of securities in the index include American depositary receipts (ADRs), common stocks, real estate investment trusts (REITs), and tracking stocks. The index includes all NASDAQ listed stocks that are not derivatives, preferred shares, funds, exchange-traded funds (ETFs) or debentures.
Copyright © 2016, NASDAQ OMX Group, Inc.
Suggested Citation:
Nasdaq, Inc., NASDAQ Composite [NASDAQCOM], retrieved from FRED, Federal Reserve Bank of St. Louis; https://fred.stlouisfed.org/series/NASDAQCOM, .
Source: S&P Dow Jones Indices LLC
Release: Dow Jones Averages
Units:
Frequency:
Notes:
The observations for the Dow Jones Industrial Average represent the daily index value at market close. The market typically closes at 4 PM ET, except for holidays when it sometimes closes early.
The Dow Jones Industrial Average provides a view of the US stock market and economy. Originally, the index was made up of 12 stocks, it now contains 30 component companies in various industries. See indexology for more information.
Copyright © 2016, S&P Dow Jones Indices LLC. All rights reserved. Reproduction of Dow Jones Industrial Average in any form is prohibited except with the prior written permission of S&P Dow Jones Indices LLC ("S&P"). S&P does not guarantee the accuracy, adequacy, completeness or availability of any information and is not responsible for any errors or omissions, regardless of the cause or for the results obtained from the use of such information. S&P DISCLAIMS ANY AND ALL EXPRESS OR IMPLIED WARRANTIES, INCLUDING, BUT NOT LIMITED TO, ANY WARRANTIES OF MERCHANTABILITY OR FITNESS FOR A PARTICULAR PURPOSE OR USE. In no event shall S&P be liable for any direct, indirect, special or consequential damages, costs, expenses, legal fees, or losses (including lost income or lost profit and opportunity costs) in connection with subscriber's or others' use of Dow Jones Industrial Average.
Permission to reproduce this series can be requested from index_services@spdji.com. More contact details are available here, including phone numbers for all regional offices.
Suggested Citation:
S&P Dow Jones Indices LLC, Dow Jones Industrial Average [DJIA], retrieved from FRED, Federal Reserve Bank of St. Louis; https://fred.stlouisfed.org/series/DJIA, .
Source: U.S. Federal Open Market Committee
Source: Federal Reserve Bank of St. Louis
Release: Summary of Economic Projections
Units:
Frequency:
Notes:
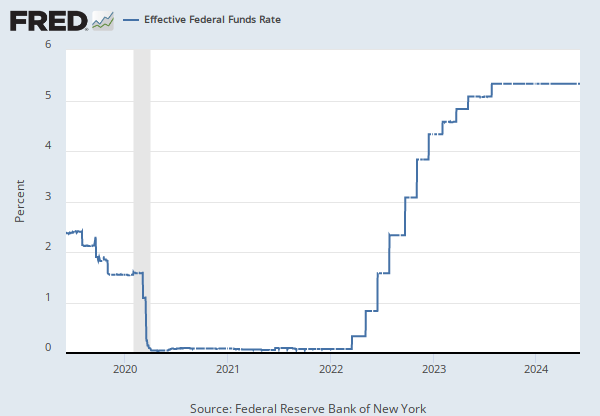
The projections for the federal funds rate are the value of the midpoint of the projected appropriate target range for the federal funds rate or the projected appropriate target level for the federal funds rate at the end of the specified calendar year or over the longer run. Each participant's projections are based on his or her assessment of appropriate monetary policy. The range for each variable in a given year includes all participants' projections, from lowest to highest, for that variable in the given year. This series represents the median value of the range forecast established by the Federal Open Market Committee. For each period, the median is the middle projection when the projections are arranged from lowest to highest. When the number of projections is even, the median is the average of the two middle projections.
Digitized originals of this release can be found at https://fraser.stlouisfed.org/publication/?pid=677.
Suggested Citation:
U.S. Federal Open Market Committee and Federal Reserve Bank of St. Louis, FOMC Summary of Economic Projections for the Fed Funds Rate, Median [FEDTARMD], retrieved from FRED, Federal Reserve Bank of St. Louis; https://fred.stlouisfed.org/series/FEDTARMD, .
Source: Federal Reserve Bank of Chicago
Release: Chicago Fed National Financial Conditions Index
Units:
Frequency:
Notes:
The Chicago Fed’s National Financial Conditions Index (NFCI) provides a comprehensive weekly update on U.S. financial conditions in money markets, debt and equity markets and the traditional and “shadow” banking systems. Positive values of the NFCI indicate financial conditions that are tighter than average, while negative values indicate financial conditions that are looser than average.
The adjusted NFCI (ANFCI). This index isolates a component of financial conditions uncorrelated with economic conditions to provide an update on how financial conditions compare with current economic conditions.
For further information, please visit the Federal Reserve Bank of Chicago's web site: http://www.chicagofed.org/webpages/publications/nfci/index.cfm
Suggested Citation:
Federal Reserve Bank of Chicago, Chicago Fed Adjusted National Financial Conditions Index [ANFCI], retrieved from FRED, Federal Reserve Bank of St. Louis; https://fred.stlouisfed.org/series/ANFCI, .
Source: Baker, Scott R.
Source: Bloom, Nick
Source: Davis, Steven J.
Release: Economic Policy Uncertainty
Units:
Frequency:
Notes:
The daily news-based Economic Policy Uncertainty Index is based on newspapers in the United States.
For additional details, including an analysis of the performance of the model, see Baker, Scott, Nicholas Bloom and Steven Davis (2012), "Measuring Economic Policy Uncertainty"
Suggested Citation:
Baker, Scott R., Bloom, Nick and Davis, Steven J., Economic Policy Uncertainty Index for United States [USEPUINDXD], retrieved from FRED, Federal Reserve Bank of St. Louis; https://fred.stlouisfed.org/series/USEPUINDXD, .
Source: Board of Governors of the Federal Reserve System (US)
Release: H.6 Money Stock Measures
Units:
Frequency:
Notes:
Before May 2020, M2 consists of M1 plus (1) savings deposits (including money market deposit accounts); (2) small-denomination time deposits (time deposits in amounts of less than $100,000) less individual retirement account (IRA) and Keogh balances at depository institutions; and (3) balances in retail money market funds (MMFs) less IRA and Keogh balances at MMFs.
Beginning May 2020, M2 consists of M1 plus (1) small-denomination time deposits (time deposits in amounts of less than $100,000) less IRA and Keogh balances at depository institutions; and (2) balances in retail MMFs less IRA and Keogh balances at MMFs. Seasonally adjusted M2 is constructed by summing savings deposits (before May 2020), small-denomination time deposits, and retail MMFs, each seasonally adjusted separately, and adding this result to seasonally adjusted M1.
For more information on the H.6 release changes and the regulatory amendment that led to the creation of the other liquid deposits component and its inclusion in the M1 monetary aggregate, see the H.6 announcements and Technical Q&As posted on December 17, 2020.
For questions on the data, please contact the data source. For questions on FRED functionality, please contact us here.
Suggested Citation:
Board of Governors of the Federal Reserve System (US), M2 [M2SL], retrieved from FRED, Federal Reserve Bank of St. Louis; https://fred.stlouisfed.org/series/M2SL, .
Source: U.S. Bureau of Economic Analysis
Release: Personal Income and Outlays
Units:
Frequency:
Notes:
BEA Account Code: DPCERC
A Guide to the National Income and Product Accounts of the United States (NIPA).
Suggested Citation:
U.S. Bureau of Economic Analysis, Personal Consumption Expenditures [PCE], retrieved from FRED, Federal Reserve Bank of St. Louis; https://fred.stlouisfed.org/series/PCE, .
Source: Ice Data Indices, LLC
Release: ICE BofA Indices
Units:
Frequency:
Notes:
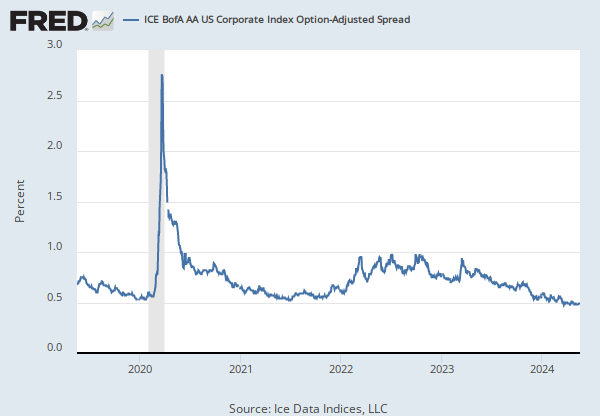
This data represents the Option-Adjusted Spread (OAS) of the ICE BofA US Corporate C Index, a subset of the ICE BofA US High Yield Master II Index tracking the performance of US dollar denominated below investment grade rated corporate debt publicly issued in the US domestic market. This subset includes all securities with a given investment grade rating CCC or below.
The ICE BofA OASs are the calculated spreads between a computed OAS index of all bonds in a given rating category and a spot Treasury curve. An OAS index is constructed using each constituent bond's OAS, weighted by market capitalization. When the last calendar day of the month takes place on the weekend, weekend observations will occur as a result of month ending accrued interest adjustments.
Certain indices and index data included in FRED are the property of ICE Data Indices, LLC (“ICE DATA”) and used under license. ICE® IS A REGISTERED TRADEMARK OF ICE DATA OR ITS AFFILIATES AND BOFA® IS A REGISTERED TRADEMARK OF BANK OF AMERICA CORPORATION LICENSED BY BANK OF AMERICA CORPORATION AND ITS AFFILIATES (“BOFA”) AND MAY NOT BE USED WITHOUT BOFA’S PRIOR WRITTEN APPROVAL. ICE DATA, ITS AFFILIATES AND THEIR RESPECTIVE THIRD PARTY SUPPLIERS DISCLAIM ANY AND ALL WARRANTIES AND REPRESENTATIONS, EXPRESS AND/OR IMPLIED, INCLUDING ANY WARRANTIES OF MERCHANTABILITY OR FITNESS FOR A PARTICULAR PURPOSE OR USE, INCLUDING WITH REGARD TO THE INDICES, INDEX DATA AND ANY DATA INCLUDED IN, RELATED TO, OR DERIVED THEREFROM. NEITHER ICE DATA, NOR ITS AFFILIATES OR THEIR RESPECTIVE THIRD PARTY PROVIDERS SHALL BE SUBJECT TO ANY DAMAGES OR LIABILITY WITH RESPECT TO THE ADEQUACY, ACCURACY, TIMELINESS OR COMPLETENESS OF THE INDICES OR THE INDEX DATA OR ANY COMPONENT THEREOF. THE INDICES AND INDEX DATA AND ALL COMPONENTS THEREOF ARE PROVIDED ON AN “AS IS” BASIS AND YOUR USE IS AT YOUR OWN RISK. ICE DATA, ITS AFFILIATES AND THEIR RESPECTIVE THIRD PARTY SUPPLIERS DO NOT SPONSOR, ENDORSE, OR RECOMMEND FRED, OR ANY OF ITS PRODUCTS OR SERVICES.
Copyright, 2023, ICE Data Indices. Reproduction of this data in any form is prohibited except with the prior written permission of ICE Data Indices.
The end of day Index values, Index returns, and Index statistics (“Top Level Data”) are being provided for your internal use only and you are not authorized or permitted to publish, distribute or otherwise furnish Top Level Data to any third-party without prior written approval of ICE Data.
Neither ICE Data, its affiliates nor any of its third party suppliers shall have any liability for the accuracy or completeness of the Top Level Data furnished through FRED, or for delays, interruptions or omissions therein nor for any lost profits, direct, indirect, special or consequential damages.
The Top Level Data is not investment advice and a reference to a particular investment or security, a credit rating or any observation concerning a security or investment provided in the Top Level Data is not a recommendation to buy, sell or hold such investment or security or make any other investment decisions.
You shall not use any Indices as a reference index for the purpose of creating financial products (including but not limited to any exchange-traded fund or other passive index-tracking fund, or any other financial instrument whose objective or return is linked in any way to any Index) without prior written approval of ICE Data.
ICE Data, their affiliates or their third party suppliers have exclusive proprietary rights in the Top Level Data and any information and software received in connection therewith.
You shall not use or permit anyone to use the Top Level Data for any unlawful or unauthorized purpose.
Access to the Top Level Data is subject to termination in the event that any agreement between FRED and ICE Data terminates for any reason.
ICE Data may enforce its rights against you as the third-party beneficiary of the FRED Services Terms of Use, even though ICE Data is not a party to the FRED Services Terms of Use.
The FRED Services Terms of Use, including but limited to the limitation of liability, indemnity and disclaimer provisions, shall extend to third party suppliers.
Suggested Citation:
Ice Data Indices, LLC, ICE BofA CCC & Lower US High Yield Index Option-Adjusted Spread [BAMLH0A3HYC], retrieved from FRED, Federal Reserve Bank of St. Louis; https://fred.stlouisfed.org/series/BAMLH0A3HYC, .
Source: Board of Governors of the Federal Reserve System (US)
Release: H.4.1 Factors Affecting Reserve Balances
Units:
Frequency:
Notes:
For questions on the data, please contact the data source. For questions on FRED functionality, please contact us here.
Suggested Citation:
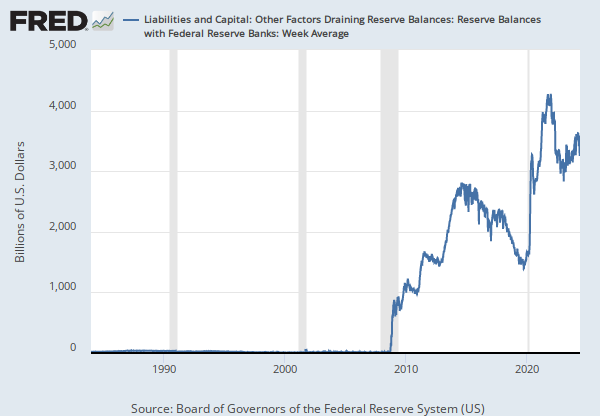
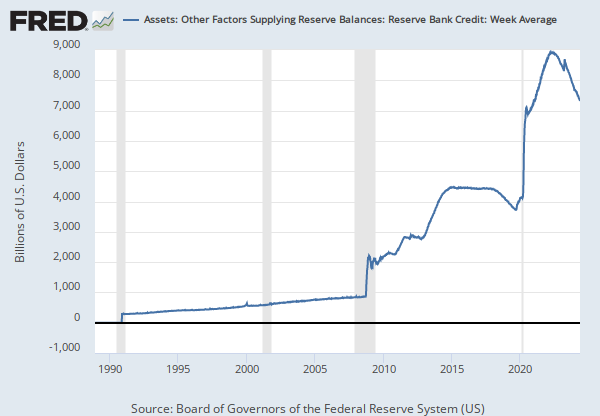
Board of Governors of the Federal Reserve System (US), Liabilities and Capital: Other Factors Draining Reserve Balances: Currency in Circulation: Week Average [WCURCIR], retrieved from FRED, Federal Reserve Bank of St. Louis; https://fred.stlouisfed.org/series/WCURCIR, .
Source: Federal Reserve Bank of St. Louis
Release: St. Louis Fed Financial Stress Index
Units:
Frequency:
Notes:
The STLFSI4 measures the degree of financial stress in the markets and is constructed from 18 weekly data series: seven interest rate series, six yield spreads and five other indicators. Each of these variables captures some aspect of financial stress. Accordingly, as the level of financial stress in the economy changes, the data series are likely to move together.
How to Interpret the Index:
The average value of the index, which begins in late 1993, is designed to be zero. Thus, zero is viewed as representing normal financial market conditions. Values below zero suggest below-average financial market stress, while values above zero suggest above-average financial market stress.
More information:
The STLFSI4 is the third revision (i.e., STLFSI3 and STLFSI2 of the original STLFSI. Whereas the STLFSI3 used the past 90-day average backward-looking secured overnight financing rate (SOFR) in two of their yield spreads, the STLFSI4 uses the 90-day forward-looking SOFR in its place. For more information, see "The St. Louis Fed’s Financial Stress Index, Version 4.0". For information on earlier STLFSIs, see "Measuring Financial Market Stress", "The St. Louis Fed’s Financial Stress Index, Version 2.0.", and "The St. Louis Fed’s Financial Stress Index, Version 3.0".
Suggested Citation:
Federal Reserve Bank of St. Louis, St. Louis Fed Financial Stress Index [STLFSI4], retrieved from FRED, Federal Reserve Bank of St. Louis; https://fred.stlouisfed.org/series/STLFSI4, .
Source: Board of Governors of the Federal Reserve System (US)
Release: Charge-Off and Delinquency Rates on Loans and Leases at Commercial Banks
Units:
Frequency:
Notes:
The 100 largest banks are measured by consolidated foreign and domestic assets.
For questions on the data, please contact the data source. For questions on FRED functionality, please contact us here.
Suggested Citation:
Board of Governors of the Federal Reserve System (US), Delinquency Rate on All Loans, Banks Not Among the 100 Largest in Size by Assets [DRALOBS], retrieved from FRED, Federal Reserve Bank of St. Louis; https://fred.stlouisfed.org/series/DRALOBS, .
Source: Board of Governors of the Federal Reserve System (US)
Release: Charge-Off and Delinquency Rates on Loans and Leases at Commercial Banks
Units:
Frequency:
Notes:
For questions on the data, please contact the data source. For questions on FRED functionality, please contact us here.
Suggested Citation:
Board of Governors of the Federal Reserve System (US), Delinquency Rate on Consumer Loans, All Commercial Banks [DRCLACBS], retrieved from FRED, Federal Reserve Bank of St. Louis; https://fred.stlouisfed.org/series/DRCLACBS, .
Source: Board of Governors of the Federal Reserve System (US)
Release: Charge-Off and Delinquency Rates on Loans and Leases at Commercial Banks
Units:
Frequency:
Notes:
For questions on the data, please contact the data source. For questions on FRED functionality, please contact us here.
Suggested Citation:
Board of Governors of the Federal Reserve System (US), Delinquency Rate on All Loans, All Commercial Banks [DRALACBN], retrieved from FRED, Federal Reserve Bank of St. Louis; https://fred.stlouisfed.org/series/DRALACBN, .
Source: Board of Governors of the Federal Reserve System (US)
Release: Charge-Off and Delinquency Rates on Loans and Leases at Commercial Banks
Units:
Frequency:
Notes:
For questions on the data, please contact the data source. For questions on FRED functionality, please contact us here.
Suggested Citation:
Board of Governors of the Federal Reserve System (US), Delinquency Rate on Business Loans, All Commercial Banks [DRBLACBS], retrieved from FRED, Federal Reserve Bank of St. Louis; https://fred.stlouisfed.org/series/DRBLACBS, .
Source: Board of Governors of the Federal Reserve System (US)
Release: Charge-Off and Delinquency Rates on Loans and Leases at Commercial Banks
Units:
Frequency:
Notes:
For questions on the data, please contact the data source. For questions on FRED functionality, please contact us here.
Suggested Citation:
Board of Governors of the Federal Reserve System (US), Delinquency Rate on Loans Secured by Real Estate, All Commercial Banks [DRSREACBS], retrieved from FRED, Federal Reserve Bank of St. Louis; https://fred.stlouisfed.org/series/DRSREACBS, .
Source: Board of Governors of the Federal Reserve System (US)
Release: Charge-Off and Delinquency Rates on Loans and Leases at Commercial Banks
Units:
Frequency:
Notes:
For questions on the data, please contact the data source. For questions on FRED functionality, please contact us here.
Suggested Citation:
Board of Governors of the Federal Reserve System (US), Delinquency Rate on Commercial Real Estate Loans (Excluding Farmland), Booked in Domestic Offices, All Commercial Banks [DRCRELEXFACBS], retrieved from FRED, Federal Reserve Bank of St. Louis; https://fred.stlouisfed.org/series/DRCRELEXFACBS, .
Source: U.S. Census Bureau
Release: Advance Monthly Sales for Retail and Food Services
Units:
Frequency:
Notes:
The value for the most recent month is an advance estimate that is based on data from a subsample of firms from the larger Monthly Retail Trade Survey. The advance estimate will be superseded in following months by revised estimates derived from the larger Monthly Retail Trade Survey. The associated series from the Monthly Retail Trade Survey is available at https://fred.stlouisfed.org/series/MRTSSM44Y72USS
Information about the Advance Monthly Retail Sales Survey can be found on the Census website at https://www.census.gov/retail/marts/about_the_surveys.html
Suggested Citation:
U.S. Census Bureau, Advance Retail Sales: Retail Trade and Food Services, Excluding Motor Vehicle and Parts Dealers [RSFSXMV], retrieved from FRED, Federal Reserve Bank of St. Louis; https://fred.stlouisfed.org/series/RSFSXMV, .
Source: Bank of Japan
Release: Bank of Japan Accounts
Units:
Frequency:
Notes:
Copyright, 2016, Bank of Japan.
Suggested Citation:
Bank of Japan, Bank of Japan: Total Assets for Japan [JPNASSETS], retrieved from FRED, Federal Reserve Bank of St. Louis; https://fred.stlouisfed.org/series/JPNASSETS, .
Source: U.S. Bureau of Labor Statistics
Release: U.S. Import and Export Price Indexes
Units:
Frequency:
Notes:
For more information, please see the Import/Export Price Indexes web site at https://www.bls.gov/mxp/
Suggested Citation:
U.S. Bureau of Labor Statistics, Export Price Index (End Use): Nonmonetary Gold [IQ12260], retrieved from FRED, Federal Reserve Bank of St. Louis; https://fred.stlouisfed.org/series/IQ12260, .
Source: U.S. Bureau of Labor Statistics
Release: Employment Situation
Units:
Frequency:
Notes:
The series comes from the 'Current Employment Statistics (Establishment Survey).'
The source code is: CES0500000003
The Average Hourly Earnings of All Private Employees is a measure of the average hourly earnings of all private employees on a “gross” basis, including premium pay for overtime and late-shift work. These differ from wage rates in that average hourly earnings measure the actual return to a worker for a set period of time, rather than the amount contracted for a unit of work, the wage rate. This measure excludes benefits, irregular bonuses, retroactive pay, and payroll taxes paid by the employer.
Average Hourly Earnings are collected in the Current Employment Statistics (CES) program and published by the BLS. It is provided on a monthly basis, so this data is used in part by macroeconomists as an initial economic indicator of current trends. Progressions in earnings specifically help policy makers understand some of the pressures driving inflation.
It is important to note that this series measures the average hourly earnings of the pool of workers in each period. Thus, changes in average hourly earnings can be due to either changes in the set of workers observed in a given period, or due to changes in earnings. For instance, in recessions that lead to the disproportionate increase of unemployment in lower-wage jobs, average hourly earnings can increase due to changes in the pool of workers rather than due to the widespread increase of hourly earnings at the worker-level.
For more information, see:
U.S. Bureau of Labor Statistics, CES Overview
U.S. Bureau of Labor Statistics, BLS Handbook of Methods: Chapter 2. Employment, Hours, and Earnings from the Establishment Survey
Suggested Citation:
U.S. Bureau of Labor Statistics, Average Hourly Earnings of All Employees, Total Private [CES0500000003], retrieved from FRED, Federal Reserve Bank of St. Louis; https://fred.stlouisfed.org/series/CES0500000003, .
Source: U.S. Bureau of Labor Statistics
Release: Employment Situation
Units:
Frequency:
Notes:
Average weekly hours relate to the average hours per worker for which pay was received and is different from standard or scheduled hours. Factors such as unpaid absenteeism, labor turnover, part-time work, and stoppages cause average weekly hours to be lower than scheduled hours of work for an establishment. Group averages further reflect changes in the workweek of component industries. Average weekly hours are the total weekly hours divided by the employees paid for those hours.
The series comes from the 'Current Employment Statistics (Establishment Survey).'
The source code is: CES0500000002
Suggested Citation:
U.S. Bureau of Labor Statistics, Average Weekly Hours of All Employees, Total Private [AWHAETP], retrieved from FRED, Federal Reserve Bank of St. Louis; https://fred.stlouisfed.org/series/AWHAETP, .
Source: U.S. Bureau of Labor Statistics
Release: Employment Situation
Units:
Frequency:
Notes:
The series comes from the 'Current Employment Statistics (Establishment Survey).'
The source code is: CES0500000001
Suggested Citation:
U.S. Bureau of Labor Statistics, All Employees, Total Private [USPRIV], retrieved from FRED, Federal Reserve Bank of St. Louis; https://fred.stlouisfed.org/series/USPRIV, .
Source: U.S. Bureau of Labor Statistics
Release: Consumer Price Index
Units:
Frequency:
Notes:
The Consumer Price Index for All Urban Consumers: All Items (CPIAUCSL) is a price index of a basket of goods and services paid by urban consumers. Percent changes in the price index measure the inflation rate between any two time periods. The most common inflation metric is the percent change from one year ago. It can also represent the buying habits of urban consumers. This particular index includes roughly 88 percent of the total population, accounting for wage earners, clerical workers, technical workers, self-employed, short-term workers, unemployed, retirees, and those not in the labor force.
The CPIs are based on prices for food, clothing, shelter, and fuels; transportation fares; service fees (e.g., water and sewer service); and sales taxes. Prices are collected monthly from about 4,000 housing units and approximately 26,000 retail establishments across 87 urban areas. To calculate the index, price changes are averaged with weights representing their importance in the spending of the particular group. The index measures price changes (as a percent change) from a predetermined reference date. In addition to the original unadjusted index distributed, the Bureau of Labor Statistics also releases a seasonally adjusted index. The unadjusted series reflects all factors that may influence a change in prices. However, it can be very useful to look at the seasonally adjusted CPI, which removes the effects of seasonal changes, such as weather, school year, production cycles, and holidays.
The CPI can be used to recognize periods of inflation and deflation. Significant increases in the CPI within a short time frame might indicate a period of inflation, and significant decreases in CPI within a short time frame might indicate a period of deflation. However, because the CPI includes volatile food and oil prices, it might not be a reliable measure of inflationary and deflationary periods. For a more accurate detection, the core CPI (CPILFESL) is often used. When using the CPI, please note that it is not applicable to all consumers and should not be used to determine relative living costs. Additionally, the CPI is a statistical measure vulnerable to sampling error since it is based on a sample of prices and not the complete average.
For more information on the CPI, see the Handbook of Methods, the release notes and announcements, and the Frequently Asked Questions (FAQs).
Suggested Citation:
U.S. Bureau of Labor Statistics, Consumer Price Index for All Urban Consumers: All Items in U.S. City Average [CPIAUCSL], retrieved from FRED, Federal Reserve Bank of St. Louis; https://fred.stlouisfed.org/series/CPIAUCSL, .
Source: U.S. Bureau of Labor Statistics
Release: Consumer Price Index
Units:
Frequency:
Suggested Citation:
U.S. Bureau of Labor Statistics, Consumer Price Index for All Urban Consumers: All Items Less Shelter in U.S. City Average [CUUR0000SA0L2], retrieved from FRED, Federal Reserve Bank of St. Louis; https://fred.stlouisfed.org/series/CUUR0000SA0L2, .
Source: U.S. Bureau of Labor Statistics
Release: Producer Price Index
Units:
Frequency:
Suggested Citation:
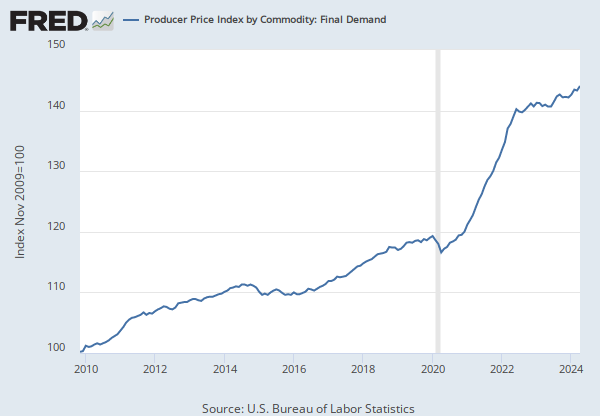
U.S. Bureau of Labor Statistics, Producer Price Index by Commodity: All Commodities [PPIACO], retrieved from FRED, Federal Reserve Bank of St. Louis; https://fred.stlouisfed.org/series/PPIACO, .
Source: U.S. Bureau of Labor Statistics
Release: Employment Situation
Units:
Frequency:
Notes:
Indexes of aggregate weekly payrolls are calculated by dividing the current month's aggregate by the average of the 12 monthly figures for the base year. Indexes are averages for production and nonsupervisory employees. For basic industries, the payroll aggregates are the product of average hourly earnings and aggregate weekly hours. At all higher levels of industry aggregation, payroll aggregates are the sum of the component aggregates.
The series comes from the 'Current Employment Statistics (Establishment Survey).'
The source code is: CES0500000017
Suggested Citation:
U.S. Bureau of Labor Statistics, Indexes of Aggregate Weekly Payrolls of All Employees, Total Private [CES0500000017], retrieved from FRED, Federal Reserve Bank of St. Louis; https://fred.stlouisfed.org/series/CES0500000017, .
Release Tables
Advance Monthly Sales for Retail and Food Services
Charge-Off and Delinquency Rates on Loans and Leases at Commercial Banks
Consumer Price Index
- CPI for U.S. City Average: Monthly, Seasonally Adjusted
- CPI for U.S. City Average: Monthly, Not Seasonally Adjusted
Economic Policy Uncertainty
Employment Situation
- Table B-1. Employees on nonfarm payrolls by industry sector and selected industry detail, Seasonally adjusted
- Table B-2. Average weekly hours and overtime of all employees on private nonfarm payrolls by industry sector, Seasonally adjusted: Average Weekly Hours
- Table B-3. Average hourly and weekly earnings of all employees on private nonfarm payrolls by industry sector, Seasonally adjusted: Average Hourly Earnings
- Table B-4. Indexes of aggregate weekly hours and payrolls for all employees on private nonfarm payrolls by industry sector, Seasonally adjusted: Index of Aggregate Weekly Payrolls
H.10 Foreign Exchange Rates
H.4.1 Factors Affecting Reserve Balances
- Table 1. Factors Affecting Reserve Balances of Depository Institutions: Wednesday Level
- Table 1. Factors Affecting Reserve Balances of Depository Institutions: Week Average
- Table 2. Maturity Distribution of Securities, Loans, and Selected Other Assets and Liabilities
- Table 5. Consolidated Statement of Condition of All Federal Reserve Banks
- Table 6. Statement of Condition of Each Federal Reserve Bank
H.6 Money Stock Measures
Personal Income and Outlays
- Table 2.6. Personal Income and Its Disposition, Monthly
- Table 2.8.5. Personal Consumption Expenditures by Major Type of Product, Billions of Dollars
Producer Price Index
- Table 8. Producer price indexes for selected commodity groupings, not seasonaly adjusted
- Goods: Goods
Summary of Economic Projections
Related Data and Content
Data Suggestions Based On Your Search


Content Suggestions


Other Formats
Japanese Yen to U.S. Dollar Spot Exchange Rate
Annual, Not Seasonally Adjusted Monthly, Not Seasonally AdjustedEconomic Policy Uncertainty Index for United States
Monthly, Not Seasonally AdjustedM2
Monthly, Not Seasonally Adjusted Weekly, Not Seasonally AdjustedPersonal Consumption Expenditures
Annual, Not Seasonally Adjusted Quarterly, Seasonally Adjusted Annual Rate Index 2017=100, Quarterly, Not Seasonally Adjusted Millions of Dollars, Quarterly, Not Seasonally AdjustedDelinquency Rate on All Loans, Banks Not Among the 100 Largest in Size by Assets
Quarterly, Not Seasonally AdjustedDelinquency Rate on Consumer Loans, All Commercial Banks
Quarterly, Not Seasonally AdjustedDelinquency Rate on All Loans, All Commercial Banks
Quarterly, Seasonally AdjustedDelinquency Rate on Business Loans, All Commercial Banks
Quarterly, Not Seasonally AdjustedDelinquency Rate on Loans Secured by Real Estate, All Commercial Banks
Quarterly, Not Seasonally AdjustedDelinquency Rate on Commercial Real Estate Loans (Excluding Farmland), Booked in Domestic Offices, All Commercial Banks
Quarterly, Not Seasonally AdjustedAdvance Retail Sales: Retail Trade and Food Services, Excluding Motor Vehicle and Parts Dealers
Monthly, Not Seasonally Adjusted Percent Change from Preceding Period, Monthly, Not Seasonally Adjusted Percent Change from Preceding Period, Monthly, Seasonally AdjustedAverage Hourly Earnings of All Employees, Total Private
Monthly, Not Seasonally AdjustedAverage Weekly Hours of All Employees, Total Private
Monthly, Not Seasonally AdjustedAll Employees, Total Private
Monthly, Not Seasonally AdjustedConsumer Price Index for All Urban Consumers: All Items in U.S. City Average
Monthly, Not Seasonally Adjusted Semiannual, Not Seasonally AdjustedConsumer Price Index for All Urban Consumers: All Items Less Shelter in U.S. City Average
Monthly, Seasonally Adjusted Semiannual, Not Seasonally AdjustedIndexes of Aggregate Weekly Payrolls of All Employees, Total Private
Monthly, Not Seasonally AdjustedRelated Categories
Factors Affecting Reserve Balances
Monetary Data
Money, Banking, & Finance
Securities, Loans, & Other Assets & Liabilities Held by Fed
Stock Market Data
Financial Indicators
Money, Banking, & Finance
Indicators
Japan
Countries
International Data
Stock Market Indexes
Financial Indicators
Japan
By Country
Daily Rates
Exchange Rates
FRB Rates - discount, fed funds, primary credit
Interest Rates
Financial Activity Measures
Economic Policy Uncertainty
Academic Data
M2 and Components
Personal Income & Outlays
National Income & Product Accounts
National Accounts
Corporate Bonds
Delinquencies and Delinquency Rates
Banking
Retail Trade
Production & Business Activity
End Use Classification System
Export Price Indexes
Trade Indexes
Prices
Total Private
Current Employment Statistics (Establishment Survey)
Population, Employment, & Labor Markets
Consumer Price Indexes (CPI and PCE)
Special Indexes
Producer Price Indexes (PPI)
Releases
More
Series from H.4.1 Factors Affecting Reserve Balances
More
Series from Nikkei Indexes
More
Series from Dow Jones Averages
More
Series from H.10 Foreign Exchange Rates
More
Series from Nasdaq Daily Index Data
More
Series from Summary of Economic Projections
More
Series from Chicago Fed National Financial Conditions Index
More
Series from Economic Policy Uncertainty
More
Series from H.6 Money Stock Measures
More
Series from Personal Income and Outlays
More
Series from ICE BofA Indices
More
Series from St. Louis Fed Financial Stress Index
More
Series from Charge-Off and Delinquency Rates on Loans and Leases at Commercial Banks
More
Series from Advance Monthly Sales for Retail and Food Services
More
Series from Bank of Japan Accounts
More
Series from U.S. Import and Export Price Indexes
More
Series from Employment Situation
More
Series from Consumer Price Index
More
Series from Producer Price Index
Tags
Supplies
Balance
Reserves
H.4.1 Factors Affecting Reserve Balances
Weekly
Loans
Board of Governors
Nation
Public Domain: Citation Requested
United States of America
Not Seasonally Adjusted
Primary
Credits
Depository Institutions
Swaps
Liquidity
Maturity
Banks
Bank Term Funding Program
Program
Funds
Net
Assets
Nikkei Inc.
Stocks
Stock Market
Japan
Daily
Indexes
Copyrighted: Citation Required
Dow Jones Averages
Dow Jones & Company
S&P Dow Jones Indices LLC
Transportation
Average
Copyrighted: Pre-Approval Required
H.10 Foreign Exchange Rates
Exchange Rate
Currency
Rate
Composite
National Association of Securities Dealers Automated Quotations
Nasdaq, Inc.
Industry
Federal Open Market Committee
Federal Open Markets Committee
Projection
Federal
Median
St. Louis Fed
Annual
Chicago Fed National Financial Conditions Index
Chicago Fed
Adjusted
Financial
Scott Baker, Nicholas Bloom and Steven J. Davis
Baker, Scott R.
Davis, Stephen J.
Economic Policy Uncertainty
Academic Data
Uncertainty
Bloom, Nick
M2 Money Stock
H.6 Money Stock Measures
Monetary Aggregates
Seasonally Adjusted
Monthly
Personal Consumption Expenditures
Consumption Expenditures
Consumption
Personal
National Income and Product Accounts
Bureau of Economic Analysis
CCC Bond Rating
Option-Adjusted Spread
BofA Merrill Lynch
BofA Merrill Lynch
Ice Data Indices, Llc
Yield
Interest Rate
Interest
Coins
Financial Stress Index
Delinquencies
Quarterly
Commercial
Consumer
Business
Real Estate
Securities
Farmland
Domestic Offices
Domestic
Dealers
Headline Figure
Parts
Vehicles
Retail Trade
Food
Sales
Retail
Services
Census
Bank of Japan
End Use
Gold
U.S. Import & Export Price Indexes
Exports
Price Index
Price
Bureau of Labor Statistics
Current Employment Statistics Survey (Establishment Survey)
Earnings
Hours
Wages
Private
Employment
Private Industries
All Items
Urban
Consumer Price Index
Inflation
Shelter
Commodities
Producer Price Index
Payrolls